BullMarketRun   BullMarketRun.ca

A Daily, Vibrant Voice Focused on Speculative Opportunities,
Commodities, and Economic & Political Trends Impacting
The Resource Sector & Equity Markets
 

"Market-Trouncing Returns Through Unbeatable
Technical & Fundamental Analysis of Niche Sectors"

May 9, 2010

Gold Bullion Development Updated Chart

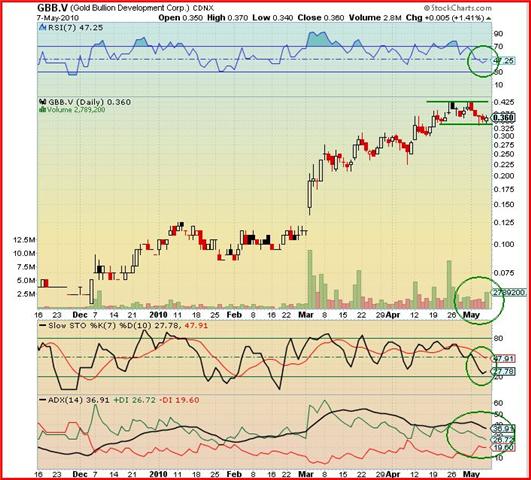
John: After four days of red bearish candles, Gold Bullion Development (GBB, TSX-V) ended Friday’s trading with a small white candle on higher than normal volume.  Given last week’s market chaos, that was no small achievement.

Looking at the daily chart we see that the last 14 trading days have confined the price moves between the limits of 33.5 cents and 42.5 cents, thus effectively working in a horizontal parallel channel.  This is base forming consolidation.

The daily volume over this period is interesting in that the volume on up days is far greater than the volume on down days, a very bullish sign.

The RSI indicator, although slightly below the 50% level, has turned up.  A move through 50% is considered a buy signal.  Looks very bullish.

The Slow Stochastics indicator shows the %K (black line) is low but has turned up and the %D (red line) has turned down, thus preparing for a bullish crossover.

The ADX trend indicator shows a slightly weakening bullish trend but all three indicators are in bullish orientation – the ADX (black line), +DI (green line) and the -DI (red line).

Friday I was able to spend some time watching the trading and what excited me more than anything that I saw on the charts was that time and again when the bid was hit, the lots were replaced.  If the price was allowed to drop a cent it was always well controlled.  There are many more bids waiting in the wings and these will come to the fore once the markets cool down their volatility and return to some sort of order to promote trust in investors.  Yes, I am excited for this company and Gold Bullion investors.  Opportunities such as this are rare, so sit back and watch a fantastic scene unfold.

May 8, 2010

The Week In Review And A Look Ahead: Part 1

CDNX and Gold

It was an incredible week on the markets with Gold moving above $1,200 again and the Dow plunging nearly 1,000 points intra-day on Thursday.  For the week, the CDNX was down 125 points or 7.5% (by comparison, the Dow fell 629 points or 5.7%, the Nasdaq plunged 195 points or 7.9%, while the TSX was off 519 points or 4.3%).

So what are we to make of this?  A lot of traders and investors are ducking, running for cover, and selling without thinking twice.  From a fundamental perspective, what’s driving the fear and sending Gold higher is uncertainty and concern regarding sovereign debt issues and the global currency system.

Let’s focus on the CDNX which has proven to be such a reliable “leading indicator”.  Here are some key points investors have to understand:

1. The Venture Exchange remains very entrenched in a long-term bull market (rising 200 and 300-day moving averages that are in no danger of reversing) and even a drop to 1200 on the Index won’t change that;

2. We have witnessed a series of higher lows with the CDNX over the course of the past 14 months as follows:  810, 1028, 1264, and 1429.  There’s a very good chance the CDNX is putting in another low right now – right around 1500, give or take 1 or 2 per cent.  That low may have been reached Friday at 1536 or we could see it very early in the coming week;

3.  The CDNX RSI level is at its lowest point since late 2008 – slightly below the levels reached at the major market bottoms identified above (810, 1028, 1264 and 1429) which occured in March, 2009, July, 2009, October, 2009, and February, 2010, respectively.   The pattern of a higher low every few months is continuing;

4. While the CDNX has dropped slightly below its 100-day SMA for the first time in over a year, it is currently underpinned by rising 50, 100, 200 and 300-day moving averages as well as an impressive zone of strong overall support ranging from 1480 to 1550;

5. Gold is likely going to break out soon to a new all-time high which has to be positive for the Gold-sensitive CDNX.

On the negative side:

1. The CDNX is clearly overdue for a nasty 20 or 30% correction which historically occurs every year or two within a bull market.  Theoretically, we could be in the midst of that now;

2. The drop below the 100-day SMA, for the first time in this new bull market cycle, raises a cautionary flag;

3. The short-term moving averages (10 and 20-day) are falling;

4. The fact the CDNX has been moving in the opposite direction of Gold and the TSX Gold Index recently is cause for some confusion and concern, suggesting that Gold is either headed for a significant drop (seemingly highly unlikely) or, alternatively, stock markets generally could be in for a major correction beyond what we’ve already witnessed.  The CDNX significantly outperformed Gold and the TSX Gold Index from December through March, correctly predicting higher Gold prices, so this sudden change raises serious questions.  Why has it happened and what does it mean?  The senior (producing) Gold companies have de-coupled from the general stock market and are now moving in tandem with Gold.  The companies actually producing Gold, right this minute, seem to be more in favor than the ones just looking for it (the Venture plays).

With regard to point #4, however, the CDNX actually slightly outperformed the Dow over the last three trading days which is significant:  If the major markets were about to go into free-fall, the CDNX normally would be leading the way – money always comes out of this speculative market first and much more quickly when investors sense a major stock market correction is on the way.  The Dow’s plunge Thursday was likely an important bottom.

As you can tell, there are some contradictory signs in the market right now.   That’s what makes this business so interesting – it’s like trying to solve a puzzle.

So taking all factors into consideration, here is our conclusion and guidance:

1. The greater probability (75%) is that the CDNX has already bottomed out or is very close to bottoming out around current levels – watch for the possibility of an intra-day plunge that could take the Index slightly below 1500, followed by an immediate and powerful reversal marking the start of a new uptrend;

2. The risk of a 20 to 30% correction right now from the 1691 April high exists (triggered by outside forces) –  we would be foolish not to recognize this possibility.  However, I am assigning a probability of only 25% to this and if it were to happen, investors would be presented with one of the best buying opportunities of a lifetime.

One cannot go against Gold at the moment, it is looking so powerful.  In fact, $1,200 could quite possibly become the new floor.  What has been highly significant regarding Gold in recent months is that it’s moving higher even with the U.S. Dollar going higher.  This breaks the previous pattern of Gold weakness during U.S. Dollar strength.  It appears Gold is going higher now no matter what the U.S. Dollar does.  What this all means fundamentally in terms of the global currency and financial system, we’ll have to wait and see.  But everyone right now should have exposure to gold in some form, either in quality gold shares and/or gold itself.

The Week In Review And A Look Ahead: Part 2

The BMR Portfolio:

Gold Bullion Development (GBB, TSX-V)

Gold Bullion bucked the overall trend Friday with a half cent gain on impressive volume of 2.8 million shares…sellers are around but there are also plenty of buyers…what was interesting Friday was Jordan Capital’s buying spree…Jordan was the earliest player in the Gold Bullion market prior to the LONG Bars Zone discovery…they handled the December financing and since early November last year through yesterday they’ve bought 8,529,000 shares and sold only 1,816,000 for the highest net position of 6,713,000…Jordan picked up 929,000 additional GBB shares yesterday at an average price of 35 cents…that was a whopping 16% single-day increase in their net position…Jordan remains hugely bullish on GBB and that is a very positive sign…Gold Bullion closed at 36 cents yesterday, its first weekly drop in a month, and the stock’s 10-day moving average is declining for the first time since late January/early February…however, Gold Bullion is underpinned by very strong technical support between 33 and 35 cents…its 20, 50, 100 and 200-day moving averages are all in bullish alignment and 20,000 metres of new drilling is now underway at Granada…this is a tremendously resilient stock with great liquidity that will be a leader in a new CDNX uptrend which could be just around the corner…Gold Bullion has traded at least a million shares a day for 22 consecutive trading days…

Seafield Resources (SFF, TSX-V)

Seafield continues to struggle and for no apparent reason other than the fact the Colombian exploration plays have cooled off considerably for the time being…we’re expecting a day of “capitulation” with Seafield that drives this stock down to as low as 12 to 14 cents where there is extremely strong support…the 300-day moving average is just above 14 cents….this stock will recover strongly in due course and perhaps rather quickly with the ramping up of its exploration projects in Colombia this month…this is not a stock to be dumping at current levels – makes no sense…Seafield closed Friday at 17 cents, a 2-cent loss on the week, and it’s currently in heavily oversold territory…we recommend “stink” bids in the 12 to 14 cent area…

Kent Exploration (KEX, TSX-V)

Kent dropped to 17.5 cents on low volume Friday to finish the week down 3.5 cents…investors are waiting for the spinoff of its Gnaweeda Gold Project into Archean Star Resources, expected almost any time now…Kent shareholders will receive one share of Archean Star for every four shares of Kent they own with the “effective date” yet to be announced…we remain extremely bullish on the prospects for both Kent and Archean Star…the quality of the projects these companies will be focusing on in the months ahead will drive shareholder value for both…Kent will be drilling its Alexander River Gold Project in New Zealand which holds 1 million+ ounce potential in addition to generating cash flow from its Flagstaff Barite Property in Washington State…Gnaweeda has huge potential and the possibility of a major discovery there is very real, so Archean Star should be a strong performer…the dividend from the spinoff makes Kent a no-brainer investment at current levels, plain and simple…

Sidon International (SD, TSX-V)

Sidon pulled back a little last week in sympathy with the overall markets but the drop in its share price was on relatively low volume…the stock closed Friday at 6.5 cents, down 1.5 cents for the week…the company is very close to finalizing a $750,000 private placement at a nickel…the stock has strong support at 6 cents and we’re expecting big things out of Sidon which has an option to purchase an 80% interest in the high grade Morogoro East Gold Property in Tanzania…

Richfield Ventures (RVC, TSX-V)

Investors’ reaction to Richfield’s news on Thursday was peculiar to say the least but understandable in the context of the extreme market volatility that day…Richfield announced it had deepened Hole BW-59 by an additional 36 metres…BW-59 graded 1.25 g/t Au over 361 metres…over 455 metres, the grade is 1.03 g/t Au and 4.3 g/t Ag…that’s an incredible hole by any standards, yet the stock sold off from $1.94 to $1.57 (near its 100-day SMA) intra-day…some common sense returned Friday as RVC finished the week at $1.78, down 23 cents for the week…Richfield’s 25,000 metre drill program continues and with Gold moving higher and more good results expected from Blackwater, there’s no reason this stock can’t go much higher…we view any weakness in Richfield as an attractive buying opportunity…

North Arrow Minerals (NAR, TSX-V)

North Arrow enjoyed its highest volume day ever last Monday when it touched 26 cents…the stock pulled back on the CDNX reversal and closed the week at 21 cents, a 3.5 cent drop…this is a great company to get positioned in now – especially on any additional overall market weakness – as there’s an excellent chance North Arrow’s attractive package of properties (diamond, lithium, base metals and gold) will deliver a significant discovery…North Arrow is led by mining legend Gren Thomas who co-founded the rich Diavik diamond deposit in the Northwest Territories in the early 1990’s…North Arrow holds 100,000 highly prospective acres at Lac de Gras where another mining icon, Dr. Chris Jennings, has identified 70 high priority kimberlite targets with his proprietary technology…North Arrow is also currently conducting a follow-up drill program at its Beaverdam Lithium Property in North Carolina where Phase 1 results were very encouraging…

Colombian Mines (CMJ, TSX-V)

Like Seafield, CMJ has become heavily oversold as investors appear to have lost some of their enthusiasm for Colombian exploration plays after problems encountered by Ventana and Greystar…generally, we believe Colombia is still very attractive for gold exploration but the system is slow down there with a degree of uncertainty and risk…it never ceases to amaze us how governments can mess things up…CMJ holds a large and very attractive package of properties and understands the Colombian system well…they’re getting good results out of their Yarumalito Property but the market has shown waning interest lately…we see no reason to sell CMJ which closed Friday at 90 cents, a 24-cent drop for the week…the likely worst case scenario for this stock is that it falls to 70 cents, its 200-day moving average…

Greencastle Resources (VGN, TSX-V)

Not much to report on Greencastle other than the fact the stock dropped another 1.5 cents this week to 12.5 cents…for long-term investors, Greencastle is a safe and very attractive buy at its current price but predicting when this stock is going to make a major move is virtually impossible…in the event of any major market upheavel, a 10-cent “stink” bid is a smart move with Greencastle which is sitting on approximately 11 cents per share in cash right now…

May 7, 2010

CDNX Reversal In The Works – A Time To Be Bullish

It has been a dramatic week on the markets.  Calls for a 2008-style market meltdown are being heard in many quarters and bearishness has jumped drastically – that’s a good (contrarian) sign.

Yes, the CDNX as we’ve already pointed out is overdue for a nasty 20 or 30% correction (a normal event once every year or two in a bull market) and there is a risk we could be in the early stages of that now – triggered perhaps by a world financial panic over debt and other issues.  The greater probability in our view, however, is that this 5-day slide we’ve witnessed represents a tremendous buying opportunity as every other pullback has with the CDNX since early last year.

The CDNX showed signs of strength and an imminent reversal today as outlined by our technical analyst below.  It’s interesting to note that the CDNX RSI level is now at its lowest point since 2008.  The CDNX also slightly outperformed the Dow over the last three days – this is significant because if we were in the early stages of a major free-fall, the Venture would be leading every market on the downside.  Historically, that’s what we’ve always seen.  A huge drop in the Venture is also not a likely event if Gold is performing well which it is – in fact, Gold appears poised to hit a new all-time high any day now.

Monday could be interesting.  Be prepared for the possibility of one final “shakeout” right off the bat Monday – a nasty drop at the open to shake the last apples off the tree, followed by a dramatic intra-day reversal to the upside.  It takes guts and nerves of steel to buy into a sharp drop like that  – you really have to keep your emotions in check – but that’s how big money can be made in the market.  We saw a reversal last Monday to the downside.    We could very easily see another one this Monday to the upside.

John, BMR’s very astute technical analyst, saw evidence of a reversal today.  Below is an updated CDNX chart with John’s comments:

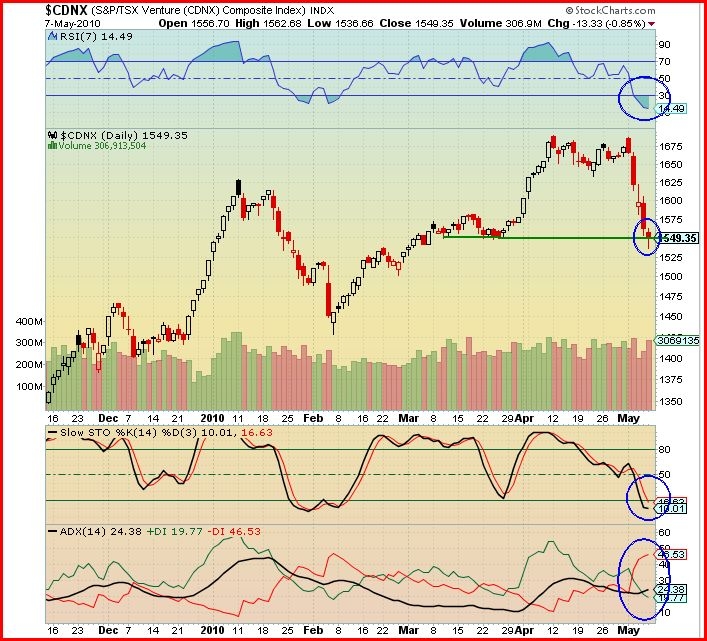
John: Today was a red letter day for the CDNX for at the end of the day it gave us what we were looking for:  a “Hammer“.

Looking at the chart, I’ve shown a green resistance line denoting the resistance from which Thursday’s candle bounced to a close a little higher.  Today the CDNX dropped to a low of 1536 before climbing back during the afternoon to close right on that resistance line at 1549.

Let me clarify one point here:  Although during the day the Index level went below 1549, it is not considered with the same importance as closing below 1549.  By climbing back to that resistance level the candle formed a hammer (blue circle), a reversal signal.  This must be confirmed by a white (bullish) candle on Monday.

What do the indicators tell us?

The RSI is well into the oversold region at 14.49 but is flattening, showing some strength is coming back.

The Slow Stochastics has both the %K and the %D in the oversold region with the %K (black line) starting to turn up.  This too is showing a reversal could be just around the corner.

The only change in the ADX indicator is the -DI indicator is starting to turn down and the +DI indictator is beginning to turn up.  Both are bullish signs.

Next week we should see a turnaround in the CDNX, starting with a bullish white candle on Monday.  We could have a very good week.  Even if it does not climb much, it will construct a firm base.

Bad Week Ends With Encouraging Sign

This was a horrible week for the stock market – the CDNX plunged 7.5%, the TSX was off 4.4%, the Dow declined 5.7% while the Nasdaq was off 7.9%.

Precious metals performed well and Gold closed the week at $1,208.  There appears to be little doubt that Gold is going to jump to new highs.  Theoretically, that should provide support to the gold-sensitive CDNX.

The CDNX showed some encouraging resilience today.  It was down as much as 29 points this morning but recovered some of those losses by the end of the day to close down just 13 points at 1549.  The CDNX is “on the edge”, as we mentioned in an article last night, and it can’t afford to fall much further without suffering some very serious technical damage and the possibility of a much more significant correction.  For now, though, we’re maintaining our position that the CDNX will find its footing at current levels (in the vicinity of its rising 100-day moving average) and start to move higher.

We have some interesting charts and articles we’ll be posting throughout the day tomorrow, so be sure to check back here over the weekend for some helpful information prior to the start of what promises to be another volatile trading week.

BMR Morning Market Musings…

Markets continue to trade erratically this morning…as of 7:45 am Pacific time, Gold is down $11 an ounce to $1,198 but should have strong support around current levels…the CDNX, the Dow and the TSX are now trading below their 100-day moving averages which is cause for concern…the fact the CDNX has been so weak recently relative to the price of Gold is also troubling…no doubt we will see much volatility again today in all markets and it’s impossible to say how this trading day will end…we could see a bloodbath today or a “hammer” reversal…the CDNX is currently down 19 points to 1544 and needs to stabilize and reverse quickly…the TSX and the Dow are each off over 200 points…Gold Bullion Development (GBB, TSX-V) is down half a penny to 35 cents…GBB is in strong shape with a major drilling program underway and enough cash in the bank to get them through any short-term market upheavels…North Arrow Minerals (NAR, TSX-V) came out with an update on its activities this morning…NAR is up half a penny on very light volume…this is a great stock to accumulate on any major market weakness…Ventana Gold (VEN, TSX-V) was halted this morning and released news of a settlement with regard to the title dispute with its La Bodega and La Baja properties in Colombia…this will remove a cloud over Ventana but at a cost of $48 million to the company which essentially drains Ventana of its cash…a $50 million pay-off however is probably a small price to pay for such a huge deposit…how this may impact the perception of doing business in Colombia is a good question as what this really amounted to was extortion…Ventana will have to arrange another major financing but they won’t be doing so from a position of strength as was the case last year…a takeover of Ventana is a growing possibility, so shareholders could benefit from that…

Gold Bullion Development Update

Market reaction to Gold Bullion’s news yesterday on the resumption of drilling at Granada was rather ho-hum but understandable given the extreme volatility of the markets.  Yesterday’s dramatic events prevented us from posting a detailed report on Gold Bullion last night as we had planned, and we apologize, but that report is in progress and we’ll be posting it over the weekend.

During this market turmoil investors need to remain focused on some key things with Gold Bullion:

1. The inherent value:   If we assume GBB has a five million ounce gold deposit on its hands, and we believe that’s a safe and conservative assumption, then the market is currently placing a value of just $8 an ounce on those projected (non-compliant) ounces;

2.  20,000 metres of drilling underway and more after that:  Gold Bullion is aggressively attacking this property and that’s going to mean constant news flow and new discoveries;

3. Preliminary Block Model update by the fall and a preliminary 43-101 resource calculation by year-end: If the initial Block Model outlined the potential of 2.4 to 2.6 million ounces within a confined area of the LONG Bars Zone, taking into account just over half the current strike length, what’s the updated Model going to project after 20,000 metres of drilling?  The market is a forward-looking machine and it’s also going to be anticipating the initial 43-101 by year-end which will have the effect of increasing the market’s per ounce valuation for Granada.

It’s not hard to see the BIG picture here and why Gold Bullion could easily command a market capitalization of several hundred million dollars within the next six to nine months if ounces are proved up at Granada as we expect.

May 6, 2010

Keep Your Eyes On The CDNX And Stay Calm

8:00 pm May 6, 2010:

Today’s market activity was incredible to say the least:  Bids disappear, the Dow plunges 1,000 points and finishes down “only” 347, the U.S. Dollar skyrockets, Gold jumps and closes in on an all-time high, rioting breaks out in Greece, and a trader apparently hits a wrong button and inadvertently dumps billions (rather than millions) of something into the futures market.  What the heck is going on here?

The best way, we believe, to sort through all the noise and the crazy talk right now and make some rational decisions about your investments is to focus on the CDNX.  The Venture Exchange has proven to be an incredibly accurate leading indicator – perhaps the best one there is – of the overall markets and even the economy in general.

So let’s look at the BIG picture.   The CDNX has certainly suffered some technical damage over the past four sessions, falling from a high of 1688 Monday to a low of 1554 today (the Index closed today at 1562).  That’s a 7.5% drop. The Venture hit and closed just above the critical major support we identified earlier – the 100-day moving average (SMA) which it has remained at or above since early 2009 when this new bull market kicked in.

Our belief and hope is that support will hold at this critical level.  It’s a very plausible argument that today’s panic in the markets was a bottom.  We may very well look back at things in a month or two and wonder why we weren’t buying like crazy when the CDNX sold off to its 100-day SMA for the first time in many, many months.

Failure to hold support around current levels would suggest, however, that we could see a nasty correction from the 1691 high last month in the magnitude of 20 to 30% (normal, we stress, by historical standards – once every year or two –  during CDNX bull markets), meaning a drop that could quickly take this market to a range between 1200 and 1360 before it moves back up again.

Right now the CDNX is on the edge.  If it continues to plunge, the Venture would be signaling to us that a short-term world financial panic could indeed be upon us.  But the good news is, this is not 2008 – overall, the CDNX remains firmly in a long-term bull market and even a 20 or 30% drop from last month’s high would not change that.

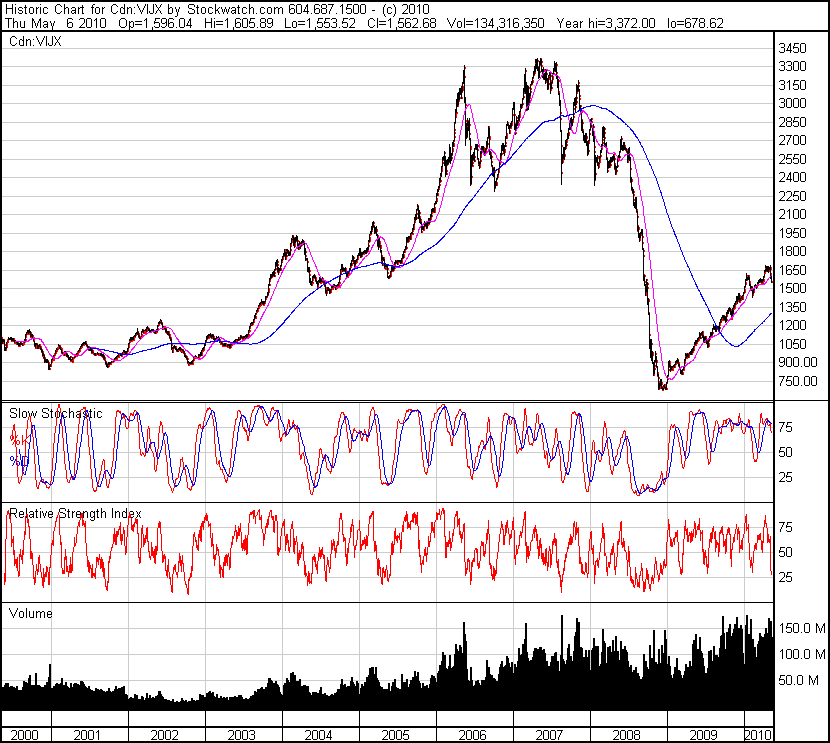
Below is a 10-year chart of the CDNX showing the 300-day SMA:

The CDNX 300-day SMA turned up late last year and is not about to reverse anytime soon, so the long-term bull market remains very much intact unlike the situation in 2008.

Note how in 2004, 2005, 2006 and 2007 the CDNX fell just below its rising 300-day SMA (often with dramatic but short-lived reversals of 20% or more) before turning back up and resuming its bull market run.

IT IS CRITICAL TO UNDERSTAND THAT WE ARE AT THE BEGINNING OF A BULL MARKET, NOT THE END OF A BULL MARKET.

So, to summarize:

The possibility of the CDNX holding support at current levels and starting a new uptrend is strong.

The possibility of the CDNX falling 20% or so from here does exist – but that would be a normal bull market correction by historical standards (one that we have already warned about here) and would also present one of the best buying opportunities of a lifetime.

Keep a close eye on the CDNX and stay calm and focused.

That is our “BIG” picture view.  Refer to “CDNX Chart – Short Term View” for John’s excellent detailed technical analysis of this week’s developments.

« Newer PostsOlder Posts »
  • All Posts: