BullMarketRun   BullMarketRun.ca

A Daily, Vibrant Voice Focused on Speculative Opportunities,
Commodities, and Economic & Political Trends Impacting
The Resource Sector & Equity Markets
 

"Market-Trouncing Returns Through Unbeatable
Technical & Fundamental Analysis of Niche Sectors"

May 6, 2010

CDNX Chart – Short Term View

John:  Today was an anomaly when the global selloff in stocks turned panicky in the afternoon with the Dow plunging below 10,000 before recovering some lost ground in the final 90 minutes.  At its worst, the Dow was down 998.50 points, which would have been its biggest loss in history.  Every North American and European market ended up in the red.  Luckily this does not occur often but when it does, sector relationships seem to go out the window – for example, the U.S. Dollar takes off and so does the price of Gold.

To examine the causes for these changes is a complex undertaking and certainly beyond the ability of the average investor/trader.  But after the event, investors are far more concerned about the effects rather than the causes.  We want to know where we stand and what to look for in the near future.  For that we can turn to technical analysis.

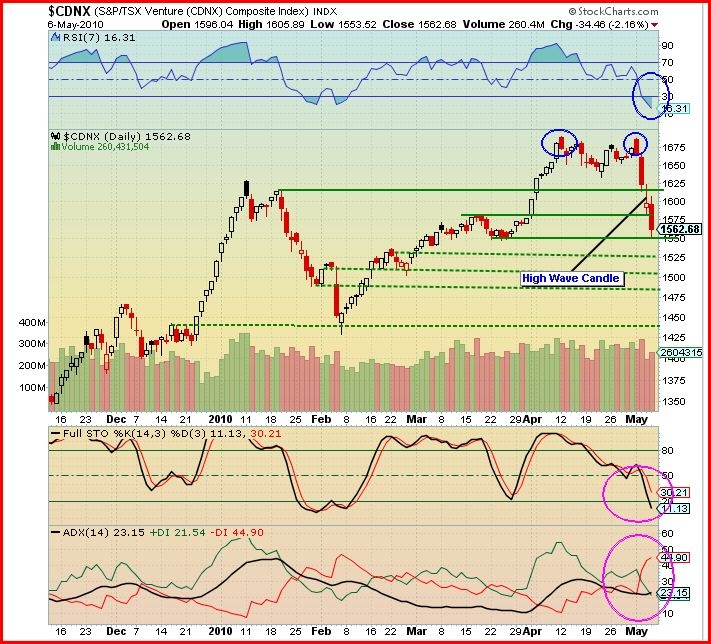
Let’s look at the chart of the CDNX:

On the chart I have put two blue circles around the two recent highs at the same level.  Together, in TA language, this forms a “Double Top”, a reversal pattern which signifies the CDNX has run out of steam.

This was followed on Tuesday by a “red candle” which stopped at the top resistance level (green line).

Wednesday’s trading formed a “high wave candle” – it has a small body and long shadows above and below the candle body.

A high wave candle portrays a situation where there is an active tug of war between the bulls and the bears, a volatile condition.  The candle shows a market that has lost a clear sense of direction.  When it occurs on high volume it indicates the market’s general confusion about the direction prices are headed.  This fall in the Index was halted at the second level of resistance (green line).

Today’s candle (red) was also stopped at a significant resistance level as shown by the bottom green line.

There is a lot of bearishness in these daily moves but as you can see they respect the resistance levels to at least pause.  I have drawn four other significant resistance levels (dotted green lines).

Well, what should we expect moving forward?

The RSI indicator has plunged to the 16% level, well into the oversold region and still heading down.  This indicates continuing weakness in the immediate future.

The Full Stochastics has both the %K and the %D lines falling with no sign of reversing – again, this is anticipating continuing weakness in the immediate future.

The ADX trend indicator has the ADX trend strength line starting to reverse upwards (strengthening) but the -DI (red line) is above the +DI (green line), indicating the downtrend is getting stronger.

Outlook:  Tomorrow will at least start to trend lower.  Keep an eye on the Index level and the resistance lines for that is where the reversal will probably occur in the form of a “hammer”.  When this will occur, it’s impossible to say.

One thing to remember here, the CDNX (and its components) is not the cause.  It is reacting to outside forces.
Special Market Update At 8 PM Pacific Time

With today’s volatile market action, we’ll be posting an overview article on the CDNX at approximately 8 pm Pacific time…

The Genius of GENIVAR

We’ll have more on this in a detailed report later today, but this morning’s Gold Bullion news release has caught our attention in a major way.

During our on-site visit for three days in March, GENIVAR geologists of course were thrilled with the LONG Bars Zone northeast discovery like everyone else.  The possibilities going further east and north gives Granada its immense blue sky potential.

What we found interesting, however, was their strong interest in the area just east of Pit #1 – namely, a rather large section that constitutes the waste pile in the northwest part of the Preliminary Block Model.  In examining historical and current geological information, they see something significant that they believe they can intersect at depth.

This morning’s Gold Bullion release confirms that the company’s 20,000 metre drill program is now underway at Granada and GENIVAR appears to have taken a very smart and strategic approach:  they are testing what’s below the waste pile, and they are also drilling right into the guts of the Block Model, attacking this north-dipping structure at an angle from the north, which could accomplish exactly what Frank Basa stated he wanted to do in the second round of drilling – drill for grade and tonnage.

GENIVAR is going to sweep right across the northern edge of the Block Model which will also lead them directly to GR-10-17 and the east-northeast extension.

The point here is that the area within the Block Model itself still holds significant potential, which GENIVAR wants to quickly confirm, and then they will fire on all cylinders to try and prove up a significant resource east and north of the Block Model.  Following that, it looks like infill and definition drilling within the heart of the Block Model.

The potential here for 5 million-plus ounces is very real as we have been stating all along and this major second round of drilling is going to go a long way in our view toward confirming that.  More later.

BMR Alert: Gold Bullion Starts Drilling And Takes Aim At The Block Model

Gold Bullion (GBB, TSX-V) has just reported that its 20,000 metre drill program in the LONG Bars Zone at the Granada Gold Property is now underway.

We are reviewing the release but at first glance we see something highly significant, geologically, in how GENIVAR is approaching this new drilling – they are aiming right at what we suspect is a wide structure that could deliver some outstanding results.  More in a special update by 11 am Pacific time.

BMR Morning Market Musings…

Gold’s intra-day reversal yesterday is being followed up this morning with more gains…Gold is up $8 an ounce as of 7:10 am Pacific time to $1,184…after a three-day slide, the CDNX is rebounding this morning and is back above 1600 at 1602, a 5-point gain…Gold Bullion Development (GBB, TSX-V) showed a “hammer” reversal yesterday and is showing strength again this morning…it’s currently up half a penny to 37 cents…yesterday’s action looked very similar to what we saw April 8 which was followed by an immediate major upside move…we expect new drilling at the LONG Bars Zone to begin soon, based on Gold Bullion’s April 22 news release…Richfield Ventures (RVC, TSX-V) came out with news this morning, delivering some quick assay results on the deepening of Discovery Hole BW-59…they extended that hole a further 36 metres for a total intersection of 361 metres grading 1.03 g/t Au…a 25,000 metre drill program continues at Blackwater…Richfield is currently at $1.70, a 24-cent drop on the day but above the low of $1.57 where the stock has very strong support…Blackwater has an excellent chance of developing into a world class bulk tonnage, open-pit deposit, so we view any weakness in Richfield as an attractive buying opportunity…Kent Exploration (KEX, TSX-V) and Sidon International (SD, TSX-V) are both quiet so far this morning…we expect more news soon from Kent regarding its spinoff…Seafield Resources (SFF, TSX-V) continues to show weakness, trading at 17 cents, but the stock has become very oversold on the charts…in situations like this, a “capitulation” day at some point occurs which marks a reversal…that’s something we are looking for with Seafield

Gold Bullion Development Update

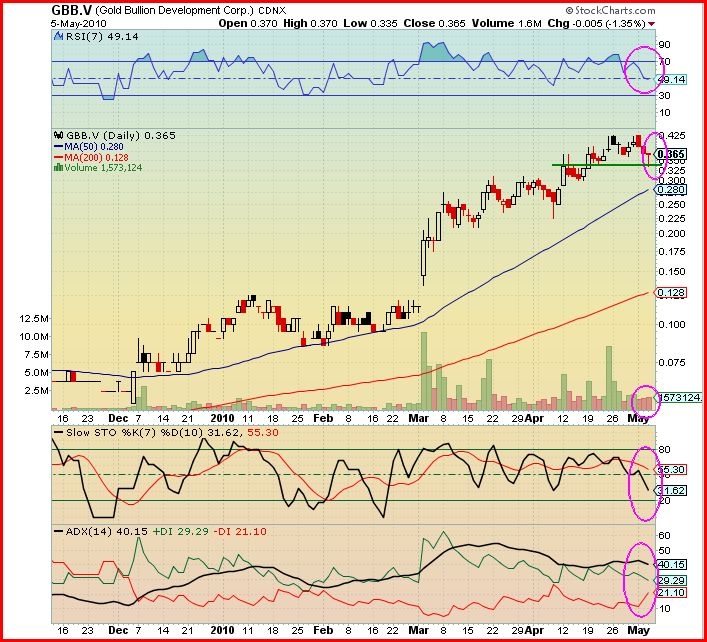
Gold Bullion Development (GBB, TSX-V) dropped below its 20-day moving average (SMA) for the first time in a month during the trading day yesterday and then abruptly reversed – the exact same event occurred April 8, just before the stock made an explosive move to the upside. So we’ll be watching GBB closely today for confirmation of an important technical event known as a “hammer reversal”.  The stock has closed down three days in a row, due to general overall market weakness, and over the past two months that has consistently proven to be a strategic entry point for traders.  BMR’s Technical Analyst takes a brief look at Gold Bullion in the updated chart below:

John: Gold Bullion ended the day on a positive note yesterday with a “hammer”.  This has to be confirmed today with a “white candle” but could be the bottom of this retracement.  The stock price fell through the Fibonacci support levels of 35 to 37 cents and found support at 33.5 cents on relatively light volume and climbed back to finish the day at 36.5 cents.

The RSI has fallen to the 49% level but has flattened out, a bullish sign.

The Slow Stochastics indicator is going down but is not in the oversold region.

The ADX trend indicator is still in bullish orientation but the ADX trend strength line shows a small sign of weakening.

Today could be a relatively strong day for GBB.

May 5, 2010

BMR Alert: Gold Bullion Development

With drilling set to resume at the LONG Bars Zone, and perhaps even already underway given the most recent news release, and with GBB almost at the same RSI level it was at its April low, this is clearly now a time for immediate accumulation.  The general market weakness has knocked Gold Bullion down to a very strong area of technical support in the mid-30’s where it could quickly rebound and commence a new leg to the upside.

The trading action this morning suggests this could be an important reversal day for the stock.

BMR Morning Market Musings…

Markets dropped heavily at the opening bell this morning and the CDNX fell as low as 1581, as close as it has come to its rising 100-day moving average (just above 1560) since this year’s market bottom in early February…this could be shaping up as an important “reversal” day, one that our technical analyst said to watch out for in his piece this morning…as of 8:35 am Pacific time, the CDNX has recovered to 1595 – a 27 point drop on the day after a 43 point drop yesterday…this has the “feel” of a bottom – we’ll see what the next few days bring…Gold sold off to $1,156 this morning but has rebounded strongly…Gold is now up a dollar on the day at $1,173…the U.S. Dollar is again significantly higher this morning, so in light of that Gold is performing extremely well…Gold Bullion Development (GBB, TSX-V) hit a low of 33.5 cents this morning but it too has rebounded in what could very well be an important “hammer” reversal…the stock is now down just half a penny at 36.5 cents on just over a million shares…Jordan Capital swooped in on weakness during the first half hour of trading, an encouraging sign…Gold Bullion continues to look very strong, fundamentally and technically, and immediate accumulation at these levels makes sense…North Arrow Minerals (NAR, TSX) is down a penny to 22 cents…North Arrow is extremely attractive at current levels and the market weakness is providing some unexpected but welcome accumulation opportunities with this stock…Sidon International (SD, TSX-V) has pulled back to 6.5 cents but on low volume, a clue that the overall uptrend remains intact and the stock is just taking a temporary “breather” after a strong run last week…we expect the company to close its $750,000 financing very soon…Richfield Ventures (RVC, TSX-V) has rebounded after touching a low of $1.81 this morning…Richfield is now up 12 cents to $1.99, so there too we have a “hammer” reversal…Kent Exploration (KEX, TSX-V) continues to be a “no brainer” buy with the upcoming shareholder dividend in the form of Archean Star shares…it’s not hard to do the math….if an individual were to buy 100,000 Kent shares by the “effective” date which will be very soon, they’d receive 25,000 shares of Archean Star which is being financed at 25 cents…theoretically, the Archean Star investment would have an initial market value of approximately $6,250 as it begins trading on the CDNX…in the unlikely event Kent would drop to 15 cents, the investor is still ahead $2,250 or 12%…we actually expect Kent to perform extremely well in the coming months, even without Gnaweeda, as it focuses on its highly prospective Alexander River Gold Property in New Zealand and the Flagstaff Barite Property that could generate $1.5 million in cash flow for Kent in the second half of this year…

« Newer PostsOlder Posts »
  • All Posts: