Markets are weak this morning in advance of the Fed statement later today…Gold dipped as low as $1,190 and as of 7:45 am Pacific the yellow metal is trading at $1,193, down $8 on the day…a slight pullback in Gold after a recent strong run is not surprising…any hint of “quantitative easing” by the Fed later today should give Gold another boost…the Dow is down 107 points while the TSX is off 85…the CDNX, after 8 straight advancing sessions, has shed 10 points to 1459…Gold Bullion Development (GBB, TSX-V), which staged a nice reversal yesterday, has given back 4 cents this morning to 52 cents…Gold Bullion’s potential is clearly evident from results released yesterday by Osisko Mining (OSK, TSX) from Brett Resources’ (BBR, TSX-V) Hammond Reef Project in western Ontario…Brett of course is currently 77.2 per cent held by Osisko and is being fully acquired as a result of Osisko’s recent all-stock bid…the best result from 32 holes of continued infill drilling at Hammond Reef was 130 metres grading 1.07 g/t Au, almost the exact result Gold Bullion recently reported from Hole 33 within its Preliminary Block Model…our point is that while Hammond Reef is a quality resource (6.7 million ounces inferred, 259.4 million tonnes grading 0.80 g/t Au), Granada in our view is developing into an even better project and has a market cap of only $65 million vs. over $500 million for Brett…Osisko and others have to be watching developments at Granada with interest…Richfield Ventures (RVC, TSX-V), on a tear recently, is starting to pull back…it’s off a dime this morning on light volume at $1.58…Richfield should find very strong support at its 100-day moving average of $1.50…Sidon International Resources (SD, TSX-V) has been consolidating nicely recently and is unchanged this morning at 14 cents…investors are waiting for news regarding Sidon’s exploration plans for the Morogoro East Gold Property in eastern Tanzania…North Arrow Minerals (NAR, TSX-V) is up 2 pennies to 19 cents…we’re very bullish on the prospects for this company with liquidity in the stock likely increasing substantially as Gren Thomas’ crew draws closer to drilling its Lac de Gras diamond property in the Northwest Territories…
August 10, 2010
Technically Speaking…
6:15 am Pacific
Once each week at BMR, our technical analyst highlights a junior resource stock (outside the BMR Portfolio) that shows very favorable chart patterns. Investors/traders of course should perform their own due diligence, as always, and consider fundamental factors as well. This weekly feature is merely meant to introduce some possible opportunities that readers may wish to investigate. This morning, John takes a look at Sandspring Resources (SSP, TSX-V) which closed yesterday at $1.45:
John: Sandspring Resources is developing a very promising open-pit gold deposit in Guyana. The following is taken directly from their web site:
“Sandspring is an exciting, relatively new public company representing 10 years of private operational experience in the Republic of Guyana. The former private company predecessor is now a wholly owned subsidiary of Sandspring. The production history of the Company is surface alluvial and saprolite mining in Guyana.
The future of the Company is based on development of an underlying primary bedrock gold-copper deposit at Toroparu discovered in 2007. To date, a total of 900 metres of strike length have been drilled on a 10 kilometre alluvial gold trend defined by historical artisan mining in this historically rich mining area in the Upper-Puruni River region.
The latest Topoparu gold-copper deposit mineral resource estimate (released June 3, 2010) was independently modeled by P & E Consultants Inc. of Toronto as a potentially open-pitable deposit. The single open-pit optimized pit shell model features an NI-43-101 compliant indicated mineral resource of 3,692,000 ounces gold-equivalent (2,891,000 oz. gold and 288 million pounds copper) with an an additional inferred mineral resource of 1,078,000 ounces gold-equivalent (895,000 oz. gold and 66 million pounds copper).”
Further to the above announcement Sandspring presented new drill results including 151 metres of 1.07 g/t Au in Hole TPD-80, 400 metres northwest along strike on step-out from the current Toroparu gold-copper resource.
In addition there has been recent insider buying and with only 80 million shares fully diluted this company, located in a calm political climate, is certainly worth some serious due diligence.
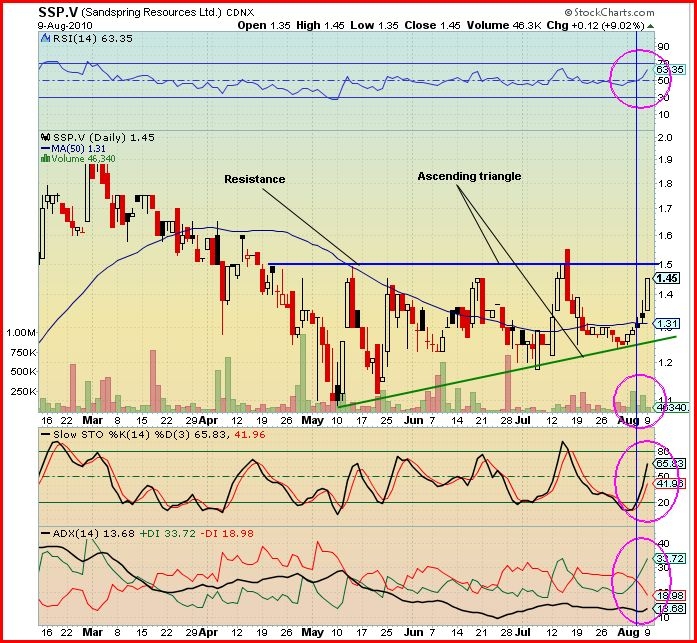
Yesterday, Sandspring opened at $1.35 and then climbed steadily through the day to close at its high of $1.45 – up 12 cents (9%) on very light volume of 46,000 shares.
Looking at the chart we see that from March 1 to May 10 Sandspring traded in a steady decline and bottomed around $1.10. Since then it has consolidated in an ascending triangle with the horizontal blue line the resistance level and the green sloping line the trendline support. On two occasions the resistance has been hit but both times the volume was very small, so to break down this resistance the stock needs a substantial increase in volume.
Looking at the indicators:
We see that the RSI has broken above the 50% level and reached 63% – bullish.
The Slow Stochastics shows that the %K (black line) crossed above the %D (red line) below 20% and both are heading up – bullish.
The ADX trend indicator shows the +DI (green line) has crossed up over the -DI (red line) – see thin vertical blue line – and is climbing. The ADX (black line) trend strength indicator is low at 18 and has started to turn up – a very bullish scenario.
Outlook: With the chart pattern and indicators in a very bullish arrangement, the main ingredient needed for Sandspring to make a good run is a large increase in volume. For interested readers, a safe entry point here would be if the price breaks through the resistance and closes above it for two days on high volume – then a break has been established. Put this one on your watch list.
August 9, 2010
BMR Morning Market Musings…
Gold is taking a breather today after its recent strong run…the yellow metal dipped as low as $1,199 but as of 7:30 am Pacific time it’s trading at $1,203, off $2 for the day…following China’s decision to open up its Gold market by allowing more banks to trade in bullion, Indian banks have decided to approach the Reserve Bank of India for permission to trade in gold…at present, Indian banks are only allowed to sell gold – they cannot buy it… the CDNX, looking for its 8th straight winning session, is up another 3 points this morning to 1468…Gold Bullion Development (GBB, TSX-V) is down 3 more pennies to 51 cents…the stock is in a zone of very strong technical support and astute investors will recognize the current weakness for what it is – an early Christmas gift, but grab it while you can…first assay results from the highly prospective LONG Bars Zone “eastern extension” area could “theoretically and potentially come any day now” according to Gold Bullion President and CEO Frank Basa, who was very upbeat when we spoke to him last week to confirm an upcoming interview…given some very obvious clues (visual observations, mineralization encountered near surface and at depth, etc.) in the last 2 Gold Bullion news releases, in addition to publicly available technical reports including Willoughby’s 1994 “Geology, Structure and Gold Mineralization on the Granada Extension Property“, we have every reason to believe that Gold Bullion has hit some “sweet spots” in the east that could produce some spectacular drill results out of at least some of the 27 holes completed in that area as of July 28 (drilling continues)…these holes cover a surface area nearly 400 metres north-south and 400 metres east-west and are outside the 2.4 to 2.6 million ounce Preliminary Block Model (potential non-compliant resource estimate)…not only does mineralization appear to be broad-based and near-surface throughout the Block Model and the eastern extension area drilled to date, but the July 29 news release also stated there are “very encouraging showings” below 150 metres vertical depth where only limited historical drilling has occurred…this is interesting as it supports the theory of a Granada feeder system at depth…Willoughby’s 1994 report states (on page 34): “A large circular feature interpreted from air photos encloses most of the Granada Mine Property and suggests an intrusive stock at depth, perhaps the feeder for the numerous sills and dykes mapped at surface“…the LONG Bars Zone gets more and more fascinating as we continue to study it and as drilling and results come in…we are convinced a massive discovery is in the works here…Sidon International Resources (SD, TSX-V), which is up some 200% since we introduced that company just 4 months ago, is off a penny to 14 cents this morning…Sidon is consolidating nicely and unwinding its recently overbought technical condition…Richfield Ventures (RVC, TSX-V), which has been on a tear recently, is off a penny to $1.72…we’re looking for a near-term pullback to about $1.50 (the 100-day moving average) on Richfield…
August 8, 2010
The Week In Review And A Look Ahead: Part 2 of 2
The BMR Portfolio
Gold Bullion Development (GBB, TSX-V)
Gold Bullion closed Friday exactly at its rising 50-day moving average (54 cents) and is sitting comfortably in a strong zone of technical support…it was down 4 cents on the week, somewhat surprising considering the news of July 29, but Gold Bullion bulls hold the upper hand with initial drill results imminent from the LONG Bars Zone eastern extension where GENIVAR has likely hit some “sweet spots”…the visuals on all these holes drilled east of the Preliminary Block Model (27 as of July 28) have been very encouraging as detailed in Gold Bullion’s latest news release…given the geological information we have on that area through various historical and technical reports, we’re convinced there’s a high probability GBB will deliver some spectacular results from this growing zone which has been drilled over an area nearly 400 metres north-south and nearly 400 metres east-west…all of this is outside the 2.4 to 2.6 million ounce Preliminary Block Model (potential non-compliant resource) where infill drilling continues…August, we believe, will prove to be Gold Bullion’s most exciting and important month yet as we expect initial results from the eastern extension will clearly demonstrate the multi-million ounce possibilities of the LONG Bars Zone and the Granada Gold Property as a whole…this is why we’re heading back to Granada very shortly…Gold Bullion is up an incredible 671% since we first introduced this company to BMR readers and anyone who would listen last December…if the LONG Bars Zone is what we think it is, that move is just the opening act…Osisko 2.0 is coming together…
Sidon International Resources (SD, TSX-V)
Sidon has become another BMR “home run” and is up 200% since we first introduced it just over 4 months ago…Sidon’s Morogoro East Gold Property is in an under-explored and highly prospective area of eastern Tanzania approximately 100 kilometres south of Canaco’s (CAN, TSX-V) very promising Handeni Project…an update on Sidon’s exploration plans for Morogoro East can’t be far off…plenty of blue sky potential here and a stock that is highly liquid…Sidon was down a penny on the week at 15 cents…we believe it’s only a matter of time before it breaks through a zone of resistance between 15 and 18 cents…its recently overbought condition is unwinding…
Richfield Ventures (RVC, TSX-V)
Richfield has been a very strong performer lately and was up another 22 cents this week to $1.73…the stock has essentially doubled since its late June low of 87 cents…RVC has been up 9 of the past 11 sessions and has not had a “down day” since July 21…clearly, Richfield is technically overbought at the moment but it does have a tendency to reach extreme overbought conditions before reacting…further upside potential therefore exists as a new trading week begins but we advise against chasing this stock at the moment…a wiser strategy would be to wait for a pullback that could test the 100-day moving average around $1.50…we are very bullish on the prospects for Richfield’s Blackwater Project in central British Columbia, so we do see exciting developments in store for this company over the balance of the year as its 25,000 metre drill program continues…
Seafield Resources (SFF, TSX-V)
Seafield has firmed up slightly and volume is starting to increase as initial drill results from Miraflores draw closer…they will likely be out sometime this month…Seafield closed Friday at 18 cents, its highest weekly close since late June…the stock’s 50-day moving average, which has been in decline since early May, has now flattened out at 17.5 cents…investors need to be patient with this one…Seafield could deliver some huge returns before the year is out, but investors will need to wait until conditions on the ground really start to come together and that means more drilling and good results at the Quinchia Project in Columbia…we expect this story will really heat up during the 4th quarter (October through December)…
North Arrow Minerals (NAR, TSX-V)
North Arrow was up 2.5 cents this past week to 19 cents…the company made a couple of announcements…they essentially doubled the size of a private placement financing due to heavy interest ($360,000 to $712,000) and also nailed down a gold property in north-Central Yukon, 70 kilometres west of ATAC Resources’ (ATC, TSX-V) newly discovered Rau (Tiger) Zone…North Arrow’s flagship diamond property at Lac de Gras is the major focus of investor interest and attention at the moment…the company is waiting for a drill permit for Lac de Gras which they hope to receive later this month…upon receipt of that approval, North Arrow will start a 1,500 metre drill program to rest around a dozen or so high priority kimberlite tagets laid out by Chris Jennings…
Colombian Mines (CMJ, TSX-V)
Colombian is showing great support at 60 cents, right around its rising 300-day moving average…the stock closed the week at 64 cents, down a couple of pennies, on light volume…CMJ has been getting encouraging results from its Yarumalito Gold Property and has an impressive portfolio of gold, gold-copper and polymetallic projects in Colombia covering more than 150,000 hectares…the company’s entry into Colombia was early and timely which allowed it to secure such a high quality land package…the stock is down considerably off its high of the year ($1.62) but we see a good chance for a significant discovery at Yarumalito or elsewhere at one or more of CMJ’s properties in Colombia…
Kent Exploration (KEX, TSX-V)
Kent was quiet again this past week and fell half a cent on low volume to 11.5 cents…there have been 2 positive developments recently with Kent…the company completed a $1 million financing (unfortunately however at 10 cents) and has also announced the start of mining operations at Flagstaff where it has a substantial high grade barite deposit…in New Zealand, Kent is still waiting for approval to drill its promising Alexander River Gold Project (this approval process has dragged on far too long for our liking) and we’re not certain what the next step is with regard to the Gnaweeda Gold Project in Australia…the proposed spin-off of Gnaweeda into Archean Star Resources last spring was of course derailed by the Labour Government’s proposed new mining tax which has since been watered down…technically, the stock faces a lot of overhead resistance and we don’t see where the “sizzle” is going to come from to move this forward in a big way anytime soon…
Greencastle Resources (VGN, TSX-V)
Greencastle was unchanged on the week at 12.5 cents, so the stock continues to trade at cash value where it has always proven to be a great long-term buy…we don’t anticipate any near-term developments with Greencastle…this is one of those “buy and hold” situations that could take 6 months or more to pan out…
Golden Days Ahead
Gold broke above the psychologically important $1,200 barrier Friday and while it is still at a strong resistance level, the action in Gold over the past couple of weeks is encouraging and in line with our expectations. Near-term technical momentum has swung in favor of the bulls, and the fact the CDNX started moving ahead of Gold last month and is looking very strong right now suggests the outlook for the yellow metal over the coming months is extremely positive. Today, BMR’s technical analyst provides an updated Gold chart and analysis:
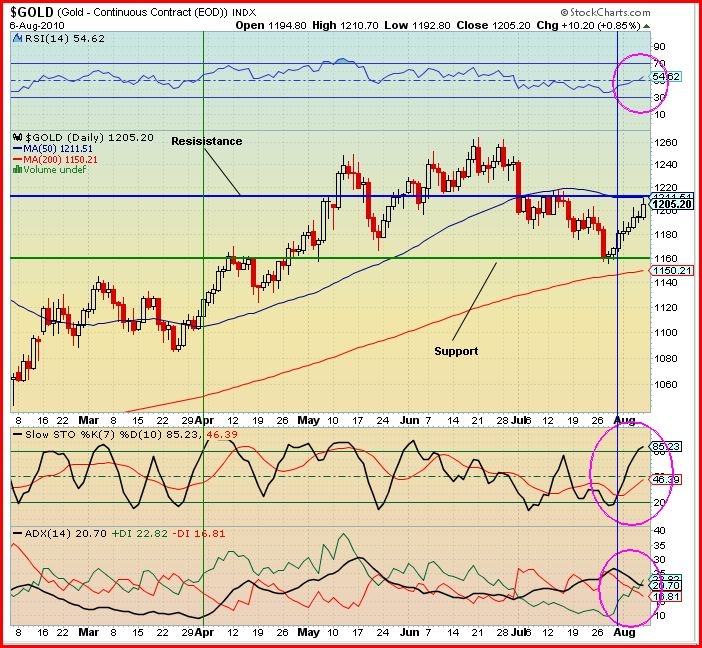
Gold is at a strong resistance level but with the bullish positions of the RSI, Slow Stochastics and the ADX, I believe we will see Gold overcome this resistance in the near future.
John: Why are we at BMR so high on Gold?
The answer is very simple: “If the markets go down, Gold will be fine. And if the markets go up, Gold will be fine too.”
The above quote is from a recent article which I have since lost (sorry about that) but I believe it hits the nail on the head.
So today we take another look at the price of Gold (continuous contract).
On Friday Gold opened at $1,195, drifted lower to $1,193, and climbed to a high of $1,211 before closing at $1,205 for a gain of $10 on the day. This was the 8th consecutive session to the upside.
Looking at the 6-month daily chart we see that the support at $1,160 (horizontal green line) held and the price of Gold has climbed steadily to reach the resistance level of $1,211 (horizontal blue line) on Friday. The SMA-50 (blue line) which provided support between the beginning of April and the beginning of July is flat and also at this resistance level. The SMA-200 is providing strong support and is pointing upwards.
Looking at the indicators:
We see that the RSI has crossed above the 50% level – bullish.
The Slow Stochastics has the %K (black line) high at 85% but this is no problem as the %D (red line) is still low at 46%. On April 1 (vertical green line), the %K was high but the price of Gold rose a lot higher before topping out. The %K crossed above the %D at a low level (blue vertical line) which indicated a strong move up. Thus, we can expect the bullish strength to continue.
The ADX trend indicator shows the +DI (green line) has crossed above the -DI (red line) for the first time since July 1, and the ADX trend strength indicator (black line) is flat and ready to turn up. A bullish trend is about to begin, which coincides with Gold’s typical period of seasonal strength.
Outlook: Gold is at a strong resistance level but with the bullish positions of the RSI, Slow Stochastics and the ADX – all showing the start of a new bullish trend – I believe we will see Gold overcome this resistance in the near future.
August 7, 2010
The CDNX Climb Continues…
It doesn’t take a rocket scientist to figure out what would happen if the CDNX were to blast through significant resistance around 1500. That would be an extremely important market development with very bullish implications, and we believe there’s a good chance it’s going to happen – the only question is how soon. BMR’s technical analyst takes a detailed look at what’s been happening recently with the CDNX:
John: The CDNX continued its bullish ways Friday by opening at 1462, drifting lower to 1458 and closing near the high of the day at 1466. Other North American markets, with the exception of the TSX, finished in the red. The CDNX is having a remarkable run with only one down session in the last 13.
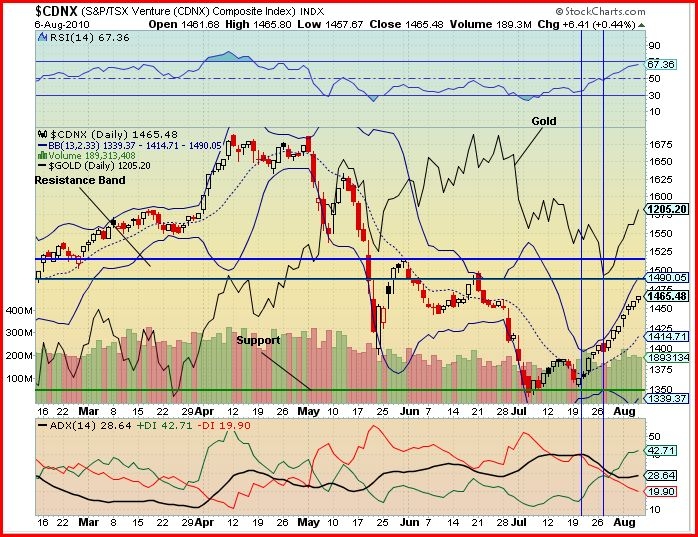
Looking at the 6-month daily chart we see that the support (green horizontal line) at 1347 has held and that the CDNX has broken through the previously identified resistance level at 1445, a very bullish sign. This market is on the move.
I have included the line chart of Gold (continuous contract) for comparitive purposes.
We see that starting on July 20 (thin vertical blue line) the CDNX made its first move to the upside and continued to do so for the following 4 sessions with the price of Gold falling during that period (a bullish divergence we’ve seen before). Then, on July 27, Gold reached a 3-month low (thin vertical blue line) and that date was the first time Gold had an affect on the CDNX (closed lower) during that short period. You can also see that the Bollinger Bands (BB) were moving up in parallel (same level of volatility) until Gold started to increase in price at which point the BB widened and Gold and the CDNX have continued to rise in tandem.
The chart also shows a resistance band (2 horizontal blue lines). This is the next first major resistance I expect the CDNX to encounter.
Looking at the indicators:
We see that the RSI has been climbing steadily, indicating smooth constant strength, but it has not reached the overbought region – very bullish.
The ADX trend indicator has the +DI (green line) above the -DI (red line) and climbing. The ADX (black line) trend strength indicator has turned up to show that the bullish trend is strengthening. Also note that the +DI crossed up over the -DI at the same time that the price of Gold reversed (thin vertical line).
Outlook: The CDNX should be able to continue to climb to the 1490 (resistance band) without much trouble. With Gold expected to continue to perform well, there’s a good chance the resistance band can be overcome. We shall see.
August 6, 2010
The Week In Review And A Look Ahead – Part 1 of 2
CDNX and Gold
It was another strong week for the CDNX which gained 39 more points to finish at 1466, its highest close since June 21…the CDNX has posted gains in 17 of the past 20 sessions and is up 7% during that period…what is unfolding is the scenario that we presented last month – the completion of a normal major correction (20%) within an ongoing bull market, and a major move back up the ladder that could very easily take the CDNX to a new 52-week high before year-end…the chart similarities to 2004 are stunning…if we’re correct, and we strongly believe we are, astute investors who are positioned now in quality junior resource stocks stand to make massive gains over the next couple of months and beyond…this is the complete opposite view of the “Global Castastrophe Alert” recently issued by technical analyst Clive Maund and a similar “sky is falling” scenario that is being propagated by others…they obviously haven’t looked closely at what the CDNX is doing…the Venture Exchange has proven to be such an accurate and reliable leading indicator of future market and economic activity that the prospect of a “crash” anytime soon in the broad stock markets or the economy in general simply doesn’t exist based on the very bullish CDNX chart…our technical analyst will be reviewing the CDNX in much more detail over the weekend…this market does face significant technical resistance around 1500 which we expect it will test in the near future (sometime this month)…the first attempt to get through 1500 may not succeed, and that would be quite normal…we could see a reaction but a very modest one that would have the positive effect of cleansing any overbought conditions while keeping the Index at or above its 50-day moving average (SMA) which currently stands at 1430…fueled however by a reversal very soon in its 50-day SMA, and underpinned by rising 200 and 300-day moving averages, the CDNX will likely bust through that resistance within the next few weeks and then some really serious action begins…this market clearly bottomed in early July, so what we’re seeing now is no “sucker rally” – it is the beginning of a potential explosive upside breakout which historically has often occurred very soon after the CDNX has hit an important bottom…investors need to appreciate the significance of what is developing here…Gold, meanwhile, has ended a 6-week downtrend (the CDNX has been telling us a reversal in Gold was imminent) with bulls regaining control Friday as Gold got above $1,200 again to close at $1,206…a reversal in Gold’s 14-day moving average, a very reliable indicator, confirms that the near-term outlook for Gold has improved considerably…a period of seasonal strength is also quickly approaching (usually mid-to-late August)…we don’t believe Gold is ready immediately to shoot up like a rocket, but there should be good strength in this market over the next few months and a move to around $1,350 during that time seems very reasonable…possible more “quantitative easing” by the Fed and China’s decision this week to increase the scope of its banking sector that’s allowed to import, export and deal in Gold are positive developments for the yellow metal…
BMR Morning Market Musings…
The scenario we laid out with Gold last month appears to have been bang-on, and the yellow metal is now trading above the important $1,200 level…Gold is up $14 an ounce to $1,209 as of 8:30 am Pacific…we’ll see if it can hold these gains today and perhaps surge even a little higher…near-term technical momentum has swung in favor of the bulls…the U.S. Dollar is down sharply, over half a cent to just above 80 on the Index…the CDNX is flat at 1459 and appears destined to challenge resistance around 1500 in the near future…the potential for a huge move to the upside in the CDNX over the next few months clearly exists – the trigger for that will be a decisive move on strong volume through the rising 200-day SMA at 1500 and through the declining 100-day SMA just slightly above that…we also have to look for a reversal to the upside in both the 50 and 100-day moving averages…BMR’s technical analyst will take a detailed look at the CDNX over the weekend…any pullback or near-term weakness in the CDNX should be embraced…Gold Bullion Development (GBB, TSX-V) is off a penny to 56 cents…the stock appears to be locked in a tight range between 55 and 59 cents…we’ve clearly stated our case for a major discovery in the LONG Bars Zone eastern extension which will add significantly to the 2.4 to 2.6 million ounces already outlined as a potential non-compliant resource within the Preliminary Block Model…now we wait for the first results from the east which can’t be far off…another potential world class bulk tonnage deposit is being developed in central British Columbia by Richfield Ventures (RVC, TSX-V) which continues to climb…Richfield is up another 13 cents this morning to $1.70…this is a stock that tends to see a lot of extremes in terms of getting overbought or oversold…it’s currently overbought but has broken through important resistance at $1.60 this morning…Sidon International (SD, TSX-V) is steady at 14.5 cents and its overbought condition has been unwinding lately…
 BullMarketRun.ca