BullMarketRun   BullMarketRun.ca

A Daily, Vibrant Voice Focused on Speculative Opportunities,
Commodities, and Economic & Political Trends Impacting
The Resource Sector & Equity Markets
 

"Market-Trouncing Returns Through Unbeatable
Technical & Fundamental Analysis of Niche Sectors"

August 5, 2010

Gold Bullion Development Updated Chart And Analysis

John: Today, Gold Bullion Development (GBB, TSX-V) opened at 57 cents, traded as high as 59 cents, and closed at 57 cents on volume of 1.1 million shares.  The interesting part about today’s trading was that many times the bid at 57 or 58 cents was hit and the blocks were easily and quickly replaced.  Buyers were patient and soaked up shares to 59 cents.

On Monday, August 9, 18.7 million shares from the April financing become free trading.  It would be a mistake, however, to assume that all of a sudden a bunch of stock is going to dumped into the market.  First of all, the market has likely already absorbed some of these shares through a shorting technique as explained in today’s “Morning Musings”.  Second, a good percentage of these shares are believed to be in “strong hands” – long-term holders who have no intention of selling at current levels.  Third, there will be some investors who will elect to sell their 21.5 cent stock and “ride” the half warrant at 30 cents but they will likely do so at varying times over a period of a few weeks as we saw back in April when a bunch of 7 cent stock became free trading.

Let’s guage the effect in April and May when 13.7 million shares were released for trading (beginning April 23).  Looking at the 4-month daily chart below, I have shown a thin vertical blue line at April 23.  We see that the volume that day was over 8 million shares and the closing price was higher than the previous day.  The buyers were waiting.  There was also important news that day (the release of the Preliminary Block Model.   If we’re guided by history and common sense, I think it’s safe to assume there could be big news next week as well from Gold Bullion).

If we now look at the Chaikin Money Flow (CMF) indicator, we see that on April 23 the indicator drops below the zero line indicating selling pressure and this selling pressure continued until May 20 (thin vertical blue line).  From there, buying pressure took over.  There is no strong indication that many of the shares were shorted prior to April 23.

If we now look at July 22 (thin blue line), we see that the CMF has dropped below the zero line so we may reasonably conclude that some shorting started around this time – two weeks before the release of the April PP shares.

Over the last 4 trading sessions, 8 million shares have changed hands – a significant number of which are probably shorted shares.  From the trading pattern today, the buyers were waiting.  It’ll be interesting to see the volume next week.

The market had little problem absorbing the 7-cent PP stock in April and May when investors had a chance to sell and make 5 times their money (there was also a full warrant on that financing at 10 cents).  The overall market was also quite weak in May.  Now, those who participated in the April financing at 21.5 cents will be making just under 3 times their money if they elect to sell now, and chances are that few of them will be dumping 30 cent shares acquired through the half warrant.

Gold Bullion’s price is well supported by the SMA(50) and the RSI is flat above 50% – bullish indications.

Gold Bullion’s 10, 20, 50, 100 and 200-day moving averages are all in bullish alignment.

Outlook: The indications are that the release of the April private placement shares Monday will be a “non-event”.  In fact, the stock may begin to edge higher as the fear or confusion some investors seem to have over this subsides.
  • Share/Bookmark

Richfield Ventures: Near-Term Consolidation Expected

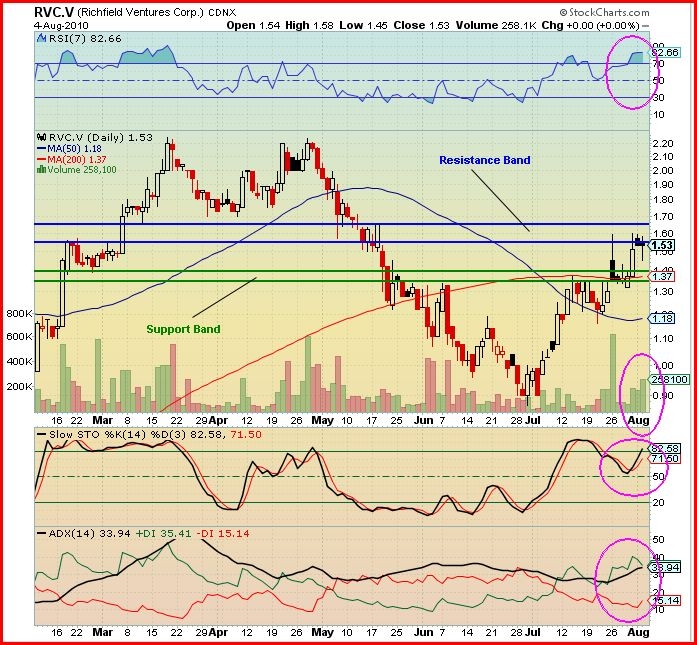
Richfield Ventures (RVC, TSX-V), developing a potential world class gold deposit with its Blackwater Project in central British Columbia, was added to the BMR Portfolio last December at $1.20.  It nearly doubled in price by March, hitting an all-time high of $2.25, before a severe correction set in that drove it to a low of 87 cents June 30.  Today Richfield closed at $1.57, an 80% jump from the low just 5 weeks ago.  Tonight, BMR’s technical analyst examines the near-term outlook for Richfield which has not had a “down day” for 10 consecutive trading sessions:

RVC is trading between a strong resistance band and a strong support band and now needs to unwind its overbought condition.

John: Today, Richfield Ventures (RVC, TSX-V) opened at $1.53, dropped only a penny lower $1.52, and closed at $1.57 for a 4-cent increase from yesterday.

Looking at the 6-month daily chart (ending Aug. 4), we see that for the last 7 sessions RVC has traded between a support band and a resistance band.  For the past few days the volume has been relatively high but the stock has not been able to overcome the resistance.

The candle Wednesday was a “spinning top”, a candle with a small real body and a small upper shadow and a long lower shadow.  This shows that the bulls and the bears are battling it out with neither one being able to take a dominant position.  The buying pressure is there but the bears counter-attack.

RVC is trading above both its SMA(50) and its SMA(200), both of which have turned to the upside.  This is a bullish sign.

Looking at the indicators:

The RSI is high in the overbought region at 83%, indicating a consolidation is required for this to move higher.

The Slow Stochastics is just entering the overbought area and has room to move up before reaching an extreme position.

The ADX trend indicator shows the +DI (green line) is above the -DI (red line) and has peaked at 40 which is rather high and now falling.  The ADX trend strength line (black) has become flat, indicating the bullish trend is weakening.  Note that the +DI peaked before the ADX line – this is to be expected.

Outlook: RVC is trading between a strong resistance band and a strong support band and is required to unwind its overbought condition before it can move up.  We will see this stock consolidate for at least the near term and then possibly move higher because it is still in a bullish trend.  Be patient.  Let the bulls and bears fight it out.

BMR Morning Market Musings…

Gold is slightly weaker this morning, down $3 an ounce to $1,193 as of 8:20 am Pacific…the CDNX, which has been up 10 of the last 11 sessions, is off 2 points to 1452…a slight pullback to around 1425 to test the 50-day moving average is certainly possible, but this is a strong market that should only get stronger in the weeks ahead…the overhead resistance at 1500 and slightly above is significant but the market should be able to overcome this by sometime in September if not a little sooner…we’re so bullish on the CDNX based on a number of technical and fundamental factors, and the 2010 chart is so strikingly similar to that of 2004 when the CDNX also bottomed in July and moved 25% higher by year-end…Gold Bullion Development (GBB, TSX-V) is up a penny to 58 cents…the shares from the April financing that officially become free trading Monday are not a big concern for us…the market soaked up the 7 cent private placement stock from December like a sponge in April and May with little downside effect…realistically, some investors will certainly sell their 21.5 cent stock (some may have done so already through a short selling technique) and “ride” the 30-cent warrant…but there will be plenty of buyers around with assays from the eastern zone expected soon…we have every reason to believe, as pointed out yesterday, that Gold Bullion may indeed pull out a few “monster holes” in the east that will take this very compelling geological story to a whole new level…those who are trading their positions need to understand the possibility exists that they could wake up one morning soon to a halted stock and a serious gap-up if GBB indeed hits a “sweet spot” in the east…out of 27 holes in the east that were described in general terms in the last news release, there’s a strong chance that at least some of them are outstanding based on the visuals and what we know so far about the geology in that area…North Arrow Minerals (NAR, TSX-V) has acquired a 100% interest in mineral claims in the north-central Yukon Territory…the target is carbonate-hosted gold mineralization similar to the newly discovered Rau (Tiger Zone) deposit of ATAC Resources (ATC, TSX-V), up 25 cents this morning on very good drill results, 70 kilometres to the east…North Arrow will immediately proceed with a program of silt sampling, prospecting and contour soil sampling…the company has also increased its recently announced private placement financing to just over $700,000…there’s a lot going on with this company, and of course North Arrow is also gearing up for a planned drill program at its flagship Lac de Gras diamond property in early September…Richfield Ventures (RVC, TSX-V) is up 2 pennies to $1.55 this morning…we’ll be posting an updated chart on RVC later today…this stock has performed very well over the past month after taking a beating in May and June…Richfield is developing the Blackwater Project in central British Columbia as a potential world class bulk tonnage gold deposit with silver and copper credits as well…Seafield Resources (SFF, TSX-V) is firming up a little bit…it’s ahead half a penny to 17.5 cents with a very strong bid at 17 cents…initial assay results from Miraflores are expected by about mid-month…we’ve pointed this out before many times, but we see a situation developing where Seafield is going to be able to add considerable ounces in the ground at its Quinchia Project by year-end…the company’s goal is to prove up a million ounces at Miraflores and another million at Dos Quebradas by year-end…a 43-101 inferred resource of 800,000 currently exists for Miraflores while there’s a non-compliant in-house estimate of 800,000 ounces for Dos Quebradas…

August 4, 2010

Technically Speaking…

Once each week at BMR, our technical analyst highlights a junior resource stock (outside the BMR Portfolio) that shows very favorable chart patterns.  Investors/traders of course should perform their own due diligence, as always, and consider fundamental factors as well.  This weekly feature is merely meant to introduce some possible opportunities that readers may wish to investigate.  Today, John takes a look at Fire River Gold (FAU, TSX-V) which is developing the highly prospective Nixon Fork Gold Project in Alaska:

John: At Fire River’s Nixon Fork Gold Mine, there is high grade gold with copper and silver credits.  Previous production averaged over 40 g/t Au.  This is a turn key operation, fully permitted and bonded.  A complete re-evaluation of the mine, mill, resource and tailings is in progress.  In addition there is significant exploration upside.

On July 26 Fire River closed a $5.5 million financing and is now waiting for regulatory approval.  The following day they announced the commencement of a 28,000 metre drill program at Nixon Fork.  The company is certainly forward thinking and progressive and is worthy of further due diligence.

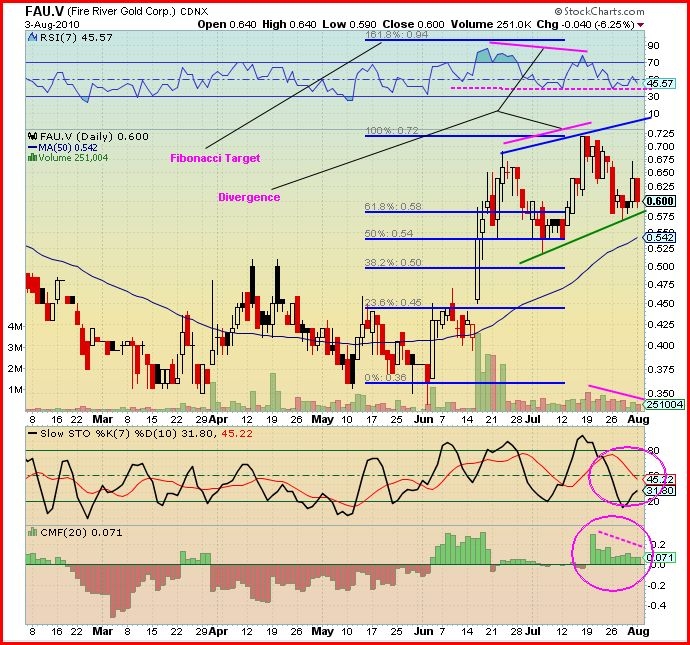
Looking at the 6-month daily chart we see that on June 10, Fire River made a major move, going from 45 cents to nearly 70 cents in 6 trading days.  It then consolidated and moved higher again, to 72 cents, in mid-July and from there it has declined marginally.  Although I have shown the price to be moving in an upsloping channel, the 2 highs of 70 and 72 cents, being so close, could be construed as a double top pattern.  This makes little difference in interpretation.  The interesting part to watch is the trend support line (green sloping line).  The stock is trading close to this line and should not go below the support.

The Fibonacci levels show the price has declined to the 68.2% support level of 58 cents.  So far this support has held.  The next Fibonacci target is 94 cents.

Looking at the indicators:

We see that a divergence occurred between the RSI and the price, thus this latest decline was to be expected.  The RSI appears to bottom out at the 40% level and is approaching that now.

The volume has been declining (mauve sloping line) during the price decline, and it’s at one of its lowest levels since mid-June.  This is to be expected during a consolidation.

The Chaikin Money Flow (CMF) indicator shows that the buying pressure, while still slightly bullish, has been steadily declining since mid-July.

The Slow Stochastics shows that the %K (black line) is rising to meet the %D (red line), indicating the possibility of a crossover to the upside in the near future.

Outlook: The fundamentals are very strong for this company which could be a successful junior gold producer in the intermediate term (18 months).  The chart and indicators suggest the price has found strong support at 58 cents.  Once the financing has been approved, and speculation begins to set in regarding drill results, Fire River has an excellent chance to stage another powerful advance.

BMR Morning Market Musings…

Gold is powering higher this morning…as of 9:40 am Pacific, the yellow metal is up $12 an ounce to $1,200 where this is clearly some technical resistance…fundamentally, the case continues to look strong for Gold with reports the U.S. Federal Reserve is looking at more “quantitative easing” and the news yesterday that the People’s Bank of China is going to increase the scope of its banking sector that’s allowed to import, export and deal in Gold beyond the current 5 largest commercial banks that are allowed to do so…the CDNX continues to look strong…it’s up another 13 points to 1454…the Venture has broken through its 50-day moving average which is very close to ending a nearly 3-month decline…there is very strong overhead resistance on the CDNX right around 1500 where the 100 and 200-day moving averages currently sit…the scenario that we see unfolding within the next 4 to 6 weeks, perhaps sooner, is the CDNX busting through that resistance at and just above 1500 and challenging its 52-week week high of 1691 by year-end…(GBB, TSX-V) has been going back and forth between 56 and 57 cents this morning…as of 9:40 am Pacific it’s unchanged at 57 cents on volume of 710,000 shares…based on the last 2 Gold Bullion news releases, the possibility of GBB delivering a spectacular hole very soon out of the eastern extension has to be considered a good possibility if for no other reason than the simple law of averages…27 holes (as of July 28) have been drilled in the eastern extension with many of them (over an area approximately 400 metres north-south and 400 metres east-west) intersecting visible gold and significant zones of altered feldspar porphyry (favorable for gold mineralization)…we like the odds here of the LONG Bars Zone eastern extension, which appears to have a strike length of several kilometres, developing into an even bigger deposit than what exists within the Preliminary Block Model which has a current potential (non-compliant) resource of 2.4 to 2.6 million ounces…Fire River Gold (FAU, TSX-V), developing the Nixon Fork Gold Project in Alaska, is up 3 pennies this morning to 63 cents but on low volume…BMR’s technical analyst will be taking a look at Fire River in a Technically Speaking article we’ll be posting within a couple of hours…Fire River recently completed a major financing at 50 cents and has commenced a 20,000 metre drill program at Nixon Fork…Kent Exploration (KEX, TSX-V) is finally ready to start mining high grade barite at its Flagstaff Property in northeastern Washington State, 25 kilometres south of Rossland, BC…Kent has received approval to mine up to 100,000 tonnes of barite per year at Flagstaff from the the U.S. Bureau of Land Management in Spokane…between 30,000 and 40,000 tonnes of ore is currently stockpiled at Flagstaff, and Kent already has a buyer for at least 20,000 tonnes of that…if Kent is able to mine and sell 30,000 tonnes this summer and early fall, gross revenue from that would be approximately $1.5 million while the net profit would come in around $900,000 with all-inclusive costs of about $20 per tonne…Kent recently raised nearly $1 million in a private placement at 10 cents, and all the company needs to do now is get its New Zealand and Australian gold exploration back on track…Kent is unchanged at 12.5 cents…

August 3, 2010

BMR Morning Musings…

Gold is stronger this morning, up $4 an ounce as of 7:30 am Pacific to $1,186…Reuters reported this morning that China is expanding the Gold market…the country will allow its banks to export and import more Gold as part of a program to push forward the development of the country’s market in the precious metal…the People’s Bank of China also said it would allow banks to hedge their positions in Gold in overseas markets…according to Frank Holmes, CEO of U.S. Global Investors, China is now the “largest gold producer in the world” and also a leading consumer…the country bought so much Gold in 2009 that it equaled 11% of global Gold demand…China’s central bank currently holds 1,054 tons of gold, and in the first quarter of 2010, jewelry demand in the country grew 11% to 105.2 tons, according to the World Gold Council…oil prices have made a nice move (up 55 more cents this morning to $81.89, a 3-month high) and the strength in copper prices (up 20% since copper put in a bottom June 7) is a very positive sign of a pick-up in demand and an improving overall worldwide economy…the copper price has proven to be a very accurate leading indicator…so too is the CDNX which is up another 12 points this morning to 1438…we turned very bullish on the CDNX a few weeks ago, shortly after a bottom was put in at 1343…BMR is returning to the LONG Bars Zone for an important site visit imminently…we have a couple of properties to check out in Quebec but Granada is first on our list after last Thursday’s news that indicates something potentially very big is unfolding in the eastern extension of Gold Bullion’s Granada Gold Property, 65 kilometres west of Osisko’s (OSK, TSX) massive Canadian Malartic Deposit…we spoke with GBB President & CEO Frank Basa yesterday who has agreed to an in-depth interview with us very shortly…he stated a lot of geological information is being compiled and reviewed at the moment, and he’ll be ready to talk at length very soon…he also stated, “theoretically and potentially, the first assay results from the eastern extension could come any day now”…he added he can’t say for sure when more news will be out (assay labs all over Quebec and Ontario are slow right now) but quite a few holes are “in the pipeline” and the flow of results is underway after three months of drilling…he sounded upbeat and extremely encouraged by the very good visuals GENIVAR is getting in the eastern extension where 27 Phase 2 holes (6,000 meters) had been drilled as of July 28….after reviewing Thursday’s news in more detail in addition to historical reports on Granada and the area, BMR is more convinced than ever that the length of the LONG Bars Zone will prove to be stunning with a north-south width of approximately 400 metres and a thickness that appears to be increasing going east…GBB is off 2 pennies in early trading at 56 cents…Sidon International (SD, TSX-V) has released a 43-101 report through Sedar on its Morogoro East Gold Property in Tanzania…the stock is up another penny to 17 cents, a 240% jump from when we first introduced this company to BMR readers just over 4 months ago…North Arrow Minerals (NAR, TSX-V) is looking strong this morning…NAR is up 3.5 cents to 20 cents on improved volume…investors are beginning to take notice of the company’s highly prospective Lac de Gras diamond property in the Northwest Territories where drilling could begin in approximately a month…we’ll have much more on North Arrow in the near future…Richfield Ventures (RVC, TSX-V) convincingly broke through its 200-day moving average Friday and has clearly gained new momentum…Richfield, developing the potential world class Blackwater Gold Project in central British Columbia, is up another 6 cents this morning to $1.57…

August 1, 2010

Gold Bullion Development Updated Chart & Analysis: New Bull Run Underway

Gold Bullion Development (GBB, TSX-V) was the second most active stock on the CDNX today after releasing very significant news regarding its Granada Gold Property in northwestern Quebec.  All of Gold Bullion’s moving averages (10, 20, 50, 100 and 200) are once again in bullish alignment with the 10 and 20-day SMA’s having just turned up after being in decline for most of the month.  Tonight, BMR’s technical analyst – who made a great call on Gold Bullion just a week ago – updates the GBB chart and explains his reasons for being very bullish on this stock heading into August:

John: After yesterday’s groundbreaking news concerning Gold Bullion Development (GBB, TSX-V), investors opened their bank accounts and created an explosion of buying at the opening of trading today.  Over 1.5 million shares changed hands in the first 15 minutes and more than 2.3 million after 30 minutes.  Gold Bullion closed with a volume greater than 4.5 million shares on a day just prior to a long weekend.  Fantastic. The stock gapped up at the open to 62 cents, an increase of 7 cents from Thursday’s close, climbed to a high of 64 cents, consolidated during the day with a low of 56 cents, and closed at 58 cents for a net gain of 3 pennies on the day (and 9 cents or 19% on the week).

Let us look at the 3-month daily chart to get a picture of what has happened here.  We see that the trading in July has formed a symmetrical triangle (2 converging blue lines) and today GBB has had a breakout through the top line (black candle).  When a stock breaks out from a chart pattern, it’s known as a “Breakaway Gap”.  This breakaway gap was too powerful to be sustainable and essentially what happened was the stock proceeded to almost fill the opening gap with the day’s trading.  Trading after the August holiday will be very interesting.

Looking at the indicators:

We see that the RSI is at 59% and climbing – very bullish.

From the beginning of July until today the average volume declined during the consolidation – bullish.

The Slow Stochastics has the %K (black line) and the %D (red line) almost together around 71 and turned down because of the gap up and the fact GBB closed near the low of the day – neutral.

The ADX trend indicator has the +DI (green line) above the -DI (red line) and climbing.  With the ADX (black line) trend strength indicator turning up, together these confirm a strengthening bullish trend.

My previous update of the GBB chart was 1 week ago – July 23 – and below is what I wrote for the outlook:

Outlook:  GBB is looking very bullish with all chart patterns and indicators expecting bullish volatility in the near future.

Key moments to watch for which will confirm a new bull run has started:

1) The prices closes above the SMA(13);

2) Daily volume >2 million shares;

3) RSI breaks above the 50% level.

The next 2 weeks are going to be interesting.

Looking at the chart, you can easily see that the 3 conditions for the start of a new bull run have been met (vertical green line) and, yes, it has been interesting.

The outlook for next week will be to look for good volumes, >1 million shares a day, and a steady increase in price as investors gain an even greater appreciation for the potential of this property after a long weekend of digesting Thursday’s news.

Independent Research and Analysis of Emerging Junior Resource Companies: Speculative, Undervalued, Home Run Opportunities in Today’s Markets

Disclaimer/Disclosure:

BullMarketRun.com is completely independent from any companies it covers.  BMR accepts no compensation of any kind from any groups, individuals or corporations for coverage of any company mentioned on this site.  We accept no advertising either.  Our stock coverage is for informational purposes only and must not be viewed or interpreted as “buy”, “sell” or “hold” recommendations. No investment opinin or other advice is being rendered on any stock or company.  We strongly recommend that you consult with a qualified investment advisor, one licensed by appropriate regulatory agencies in your legal jurisdiction, and do your own due diligence and research before making any investment decisions.  The stocks we cover, by definition, are highly speculative and potentially very volatile.  Investors are cautioned that they may lose all or a portion of their investment if they make a purchase or short sale in these speculative stocks.  We are not Registered Securities Advisors. Our opinions can only be construed as a solicitation to buy and sell securities when they are subject to the prior approval and endorsement of a Registered Securities Advisor operating in accordance with the appropriate regulations in your area of jurisdiction.  It should be assumed that BMR personnel, writers and their associates may hold or dispose of or trade in positions in any securities mentioned herein at any time.  Owner/Publisher of BullMarketRun.com is Terry Dyer of Langley, British Columbia.

« Newer Posts
  • All Posts: