BullMarketRun   BullMarketRun.ca

A Daily, Vibrant Voice Focused on Speculative Opportunities,
Commodities, and Economic & Political Trends Impacting
The Resource Sector & Equity Markets
 

"Market-Trouncing Returns Through Unbeatable
Technical & Fundamental Analysis of Niche Sectors"

September 6, 2010

The Week In Review And A Look Ahead: Part 3 of 3

The BMR Portfolio (Week in Review Part 3 of 3)

Sidon International (SD, TSX-V)

Sidon finished the week on a strong note, gapping up Friday and closing at 13.5 cents on total CDNX volume of nearly 2.5 million shares…the stock remains in a very powerful uptrend with extremely strong technical support at the rising 50-day SMA of 11.5 cents…but overhead resistance and the recently proposed financing ($1.2 million at 10 cents) will likely keep Sidon range-bound until that financing is completed…the October through December period should be very interesting months for Sidon as the company during this time is expected to ramp up exploration at its Morogoro East Gold Property in Tanzania and proceed with a drill program…as Canaco (CAN, TSX-V) continues to surge, interest in companies exploring for gold in this African country remains high…Morogoro East, where artesinal miners have been very busy, is in a highly prospective and under-explored region of eastern Tanzania, approximately 100 kilometres south of Canaco’s Handeni Project…Sidon is up a whopping 170% since we introduced this company to BMR readers last March…

Richfield Ventures (RVC, TSX-V)

Richfield enjoyed one of those “company changing” weeks like we’ve also seen this year with Gold Bullion and SidonRichfield reported 6 more holes Thursday from its Blackwater Project in central British Columbia which further demonstrated the world class potential of this property…this was followed up Friday with the announcement of a proposed $14.6 million financing at $1.95…the company continues to drill long intersections of mineable grade including significant widths of 1 g/t Au or better in 3 zones at Blackwater which could be part of one large overall system…given the grades, intersections and location of drill holes Richfield has reported for the past year at this project, a deposit in the range of 3 to 4 million ounces is very possible which is why some big money has come to the table here…the stock closed Friday at $2.20 for a weekly gain of 30 cents, and the volume Thursday and Friday suggest a breakout through resistance at the $2.25 all-time high is imminent…if this occurs, as John pointed out in his article this morning, $2.25 becomes new support and a pullback to that area is quite possible especially with the financing being at $1.95…stocks can surge a bit (sometimes even 50%) during a financing but often are somewhat constrained until the financing closes…having said that, Richfield’s current market cap is only $62 million which offers a lot of upside even after an additional $17 million or so in market cap is added to the stock once the financing is completed…Richfield is up 83% since we introduced it to BMR readers last December…

Seafield Resources (SFF, TSX-V)

Seafield enjoyed an excellent week, jumping 3 pennies on increased volume to close at 19.5 cents…on Thursday it got as high as 22 cents where there is significant technical resistance…we expect big things out of Seafield over the final 4 months of the year as drilling intensifies at its Quinchia Project in Colombia and results start to flow in…technically, the stock is starting to look at lot healthier…patient investors, especially those who suffered through a difficult 6 months from March through August, should be rewarded handsomely with this one…Miraflores, Dos Quebradas and Chuscal give Seafield the potential to outline a multi-million ounce resource at Quinchia, and the company has the right people on the ground and behind the scenes to advance this project in a very effective way…Seafield is up 225% since we introduced it to BMR readers last year…

Colombian Mines Corporation (CMJ, TSX-V)

An important technical development occurred with CMJ Friday as for the first time in over 4 months it broke above its 50-day moving average, closing at 75 cents for a weekly gain of 7 cents… it appears Colombian bottomed out in July and August, showing a beautiful pattern, and is getting set to roar ahead once again…what we like about CMJ is its huge and highly prospective land package in Colombia – over 150,000 hectares – and the fact they’re not a Johnny-come-lately to this area…Yarumalito, which has been delivering very encouraging results so far, is their most advanced property but CMJ has many other solid projects in the pipeline…we introduced CMJ to BMR readers last year at 60 cents and the stock soared as high as $1.62 in March…

North Arrow Minerals (NAR, TSX-V)

North Arrow has been in the BMR “doghouse” lately for under-performance and delays in exploration plans but patience is a virtue and we’re going to wait things out a little longer to see what develops here…NAR has very explosive potential for 2 reasons right now…there is still the chance the company may drill its Lac de Gras diamond property in the very near future (i.e., possibly by late September)…a drill permit decision is expected next week…other factors will also enter into the equation as far as potential drilling is concerned, but we’re hopeful drilling will proceed…secondly, North Arrow recently picked up some gold claims in north-central Yukon where Atac Resources (ATC, TSX-V) has been so successful…if NAR decides to “seize the moment” with the interest in gold plays and get aggressive with exploration at these new claims, investors will no doubt react favorably…NAR closed the week at 15 cents, giving it a market cap of just under $7 million…liquidity is an issue with this stock but volume should improve dramatically if all the pieces of the puzzle suddenly come together…we’re not certain but we’re hopeful this could happen…

“Watch List”

Excel Gold Mining (EGM, TSX-V)

Excel closed the week at 17.5 cents, up 2 pennies, on total CDNX weekly volume of nearly 3.5 million shares…we visited the company’s Montauban Mining Camp Project, a few hours’ drive from Montreal, last Tuesday and we were very impressed…we’ll be reporting separately on this tomorrow…

Richfield Ventures Chart Update

BMR first introduced Richfield to our readers last December at $1.20.  Friday, it closed at $2.20 for a gain so far of 83%.  Like Gold Bullion, though, we strongly believe the best is yet to come from Richfield which is developing the potential multi-million ounce Blackwater Project in central British Columbia.  We interviewed Peter Bernier, Richfield’s President and CEO, last spring and we have complete confidence in his ability to steer this project forward.  Our take on Bernier is that he wants to prime Richfield for a potential takeover with the strategy being to prove up as many ounces as possible and then find a major to develop it.  On Friday, Richfield announced a proposed private placement financing of nearly $15 million at $1.95 per share with a half warrant at $2.50.  This will give the company nearly $20 million in its treasury to make things happen with Blackwater.  Following the financing, Richfield will have approximately 36 million shares outstanding and 50 million on a fully diluted basis.  Assuming Richfield is able to substantiate a deposit of 4 million ounces, which appears very possible, a conservative valuation of $50 per ounce in the ground would give this company a market cap of $200 million (its current market cap, including the proposed 7.5 million share financing, is $80 million).  So one can clearly see the upside potential that still exists with this even though the current price is just a nickel below the 52-week and all-time high.  Below, John takes a look at this very interesting stock from a technical perspective:

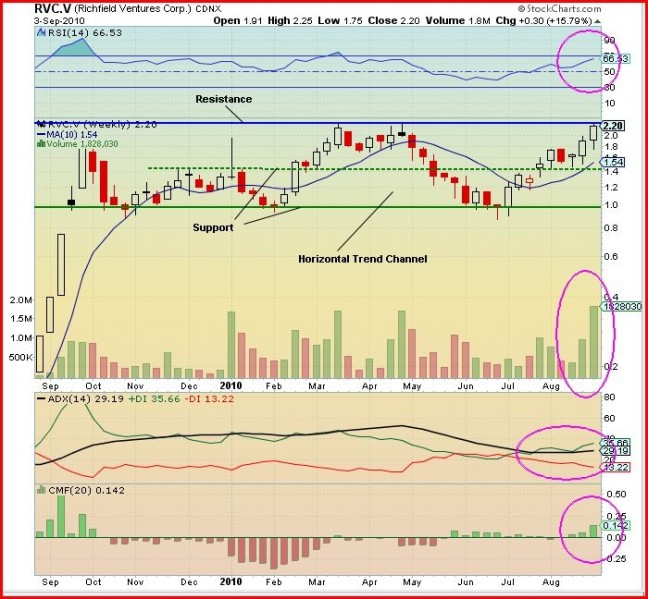
Last week, Richfield opened at $1.91, traded as low as $1.75, then climbed to $2.25 to match its all-time high.  It closed Friday at $2.20, up 30 cents or 16% for the week on total CDNX volume of 1.8 million shares.

Looking at the 12 month weekly chart we see that RVC has traded within a horizontal channel or,  in otherwords, a horizontal consolidation flag.  The top of the channel (blue line) is resistance and the bottom (green line) is support.  The dotted green line is an intermediate support level at which the stock could retrace to if a breakout attempt fails.  This channel creates solid support for a move up.   The weekly SMA(10) provides strong support within the channel during this upswing.   The two recent white candles show the stock has risen strongly from the $1.60 level on higher than average volume. Last week’s volume was the highest in the last 12 months.   Should the stock overcome the $2.25 resistance, the next Fibonnaci target level is $3.50.  This is derived by adding the depth of the channel ($1.25) to the top of the channel ($2.25).

Looking at the indicators:

The RSI is at the 66% level, below the overbought region, thus giving the price a long way to move before reaching unsustainable levels – bullish.

The ADX trend indicator has the +DI (green line) above the -DI (red line) and the  ADX trend strength line (black) is at 29 with plenty of space to move up before it reaches unsustainable levels. When it gets to 40 or above watch carefully for a possible trend weakening.  Also, remember the +DI usually peaks before the ADX line.  This is a very bullish orientation.

The Chaikin Money Flow (CMF) indicator is green and shows that the buying pressure has been increasing for the past 3 weeks with last week the highest – very bullish.

Outlook: This is the third time in the last 12 months the stock has attempted to move out of the channel to the upside.  The chart and the indicators are all saying that this is the strongest challege yet to the $2.25 resistance.  If the volume is there, this stock has an excellent chance to reach new highs next week but keep in mind there is a financing underway.  One possibility is that Richfield could run to a new high before pulling back and finding new support around $2.25 until the financing closes. 

September 5, 2010

The Week In Review And A Look Ahead: Part 2 of 3

The BMR Portfolio (Week in Review Part 2 of 3)

Gold Bullion Development (GBB, TSX-V)

It was a stellar week for Gold Bullion as it blasted through resistance between 59 and 64 cents and came within a penny of touching its all-time high of 71 cents back in June…the stock closed the week at 67 cents, up 12 cents, on CDNX volume of 8.5 million shares (plus more on the ALPHA system where GBB volume is significant)…the reason for the move, of course, was the company’s announcement that it expects to release additional assay results sometime next week from its 20,000 metre Phase 2 drill program at the Granada Gold Property (nice timing)…Gold Bullion also announced it had finalized some mining lease and claim agreements for Granada…so what should we expect next week?…the trend with GBB throughout the year has been very clear – steadily improving exploration results, and we see no reason why that trend should change now…what we hope Gold Bullion will also do is give a more detailed geological overview of what’s happening at Granada, what’s driving the mineralization, and has GENIVAR come to a better understanding of the “plumbing system”, so to speak, after 4 months of intense drilling?…for us, that’s what we’re most interested in seeing…no doubt there will be some good drill results, but a deeper understanding geologically of what’s going on will be immensely helpful…there does seem to be something different happening in the LONG Bars Zone east-northeast extension…a significant amount of porphyry is being intersected there which is interesting and it does seem to be carrying mineralization…a narrow quartz vein deposit this is not…something bigger is taking shape and we hope Gold Bullion can paint that picture for us next week…we’ve been successful with Gold Bullion because we’ve done our homework and we’ve had our boots on the ground there three times already…we know this property well and we believe 100% in its potential as a multi-million ounce open-pit deposit…we’re going into next week with complete faith, and we believe there’s an excellent chance a new and exciting chapter in Gold Bullion’s history will be written this month…


Gold Bullion Development: Updated Chart And Analysis

Gold Bullion Development (GBB, TSX-V) reported last Tuesday that it expects to release an exploration update and additional assay results from the LONG Bars Zone the week of September 6, so next week promises to be an exciting one for this stock.  In fact, the entire rest of the year for Gold Bullion is going to be extremely interesting as more drilling takes place and many more results flow in.  We absolutely love the fundamentals here.  And for the technical side of the equation we turn to John for his updated analysis of the GBB chart:

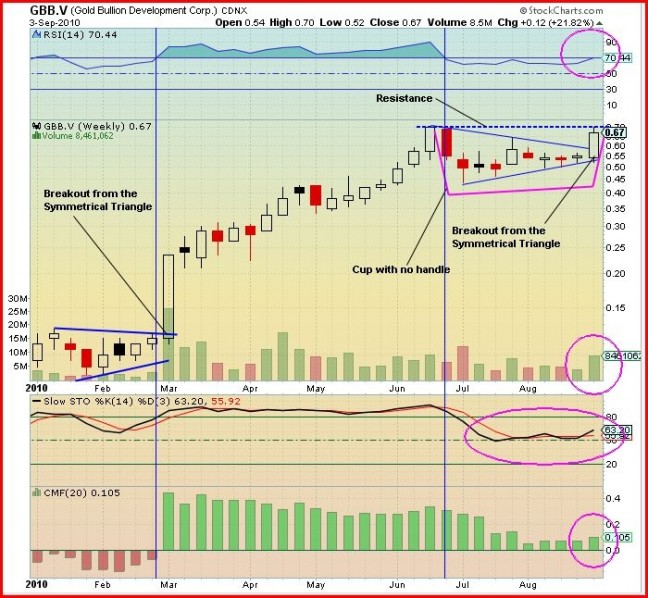
Last week Gold Bullion opened at 54 cents, traded as low as 52 cents, and then methodically climbed to 70 cents, just one penny shy of its all-time high.  It closed Friday at 67 cents, up 12 cents or 22% for the week on total CDNX volume of 8.5 million shares.  Throughout the week investors were patient, gradually moving the stock up and easily absorbing all that was offered.

Looking at the 8-month weekly chart we see that trading last week broke through the symmetrical triangle (thin blue converging lines) and almost reached the all-time high, a resistance level, at 71 cents (horizontal blue dotted line).  This was a critical move for it showed how positive the investor reaction has been to the company’s news release of August 31, stating they had finalized property agreements and also expected to release further assay results during the week of September 6.

Since the last week of June the trading pattern formed is a “cup” (mauve lines) without a “handle” at the moment.   If the news release does come out next week I doubt if a handle will form because if the news is positive, as we expect, any shares that become available below 71 cents could be quickly gobbled up (any “sell on news” could be short-lived).  This cup looks very good in that it’s not too deep and it’s “u-shaped”.

Looking at the indicators:

The RSI is right at the door of the overbought region at 70%, exactly at the same level just prior to the last breakout during the final week of February (blue vertical line, left hand side).  The previous overbought condition has completely unwound, thus there is plenty of room for a big move to the upside – very bullish.

The Slow Stochastics has formed a “W” formation just above the 50% level – very bullish.

The Chaikin Money Flow (CMF) indicator shows the buying pressure,  although higher than the previous 4 weeks, was not high.  This is a very bullish sign for it shows how little buying pressure was needed to push the stock up 22%.

Outlook: A very interesting scenario is shaping up with Gold Bullion over both the immediate and longer term.  GBB’s chart has many bullish components to it.    The news last week set the stage for investors to position themselves for a possible big break to the upside on the release of anticipated good results.  There are “deep pockets” waiting to take this stock considerably higher in a short period of time if the fundamentals are right.

September 4, 2010

The Week In Review And A Look Ahead: Part 1 of 3

CDNX and Gold

Last Sunday, August 29, BMR issued an “Investor Alert” stating:   “September is shaping up to be a possibly dramatic month of trading for the CDNX with BMR anticipating a major upside breakout.”  Indeed the CDNX did stage a significant breakout this past week, surging through major resistance around 1500 and finishing with a 5.4% weekly gain (80 points) at 1566.  As readers know, we turned extremely bullish on the CDNX in July, shortly after it bottomed at 1343 July 6.  We came to our conclusion based on a number of technical and fundamental indicators including an eye-popping comparison between the CDNX chart for this year and the one from 2004 when the market surged 25% by the end of the year from its July low.  Since this year’s July low of 1343 a couple of months ago, the CDNX has been the best performing market in North America.  It’s up a whopping 17%, more than double the performances of the Dow (8%) and the Nasdaq (7.5%), and significantly better than the TSX (9.4%) and even the TSX Gold Index (10%).  Gold itself is up only 4% since early July.  This incredible out-performance by the CDNX, which has proven to be a remarkable leading indicator, suggests several important things:  1) Gold is going to new highs;  2) There is no near-term crash in store for the major markets – in fact, they are likely to head higher;   3) The world economic recovery is stronger than most people think which will continue to fuel demand for metals;  and 4) More QE (Quantitative Easing) is on the way.  The CDNX is in a primary massive bull market which commenced in late 2008, shortly after one of the worst market crashes of all time.  Where this bull market will end is anyone’s guess but we are not yet even close to the “hysteria stage” that could send junior resource stocks skyward like the dot com boom just over a decade ago.  Near-term, the new floor for the CDNX is 1500 with technical resistance at 1575 and 1625.  The primary move is obviously up so any pullbacks should be viewed in that context (i.e., buy on weakness when the opportunity presents itself).  We have little doubt the CDNX will climb to a new 52-week high (through 1700) by year-end – it’s possible we could see something close to that within 4 to 6 weeks with Gold expected to reach new highs.  Gold had another strong week.  All of its major moving averages are in bullish alignment and the stage for a move to new all-time highs is being set (the action in the CDNX also confirms that a new high is on the way).   One of our favorite analysts is Frank Holmes, CEO of U.S. Global Investors, who believes Gold could double in price over the next 5 years (a 15% annual return).  We suggest checking out the article by Daniela Cambone Friday on Kitco as she interviewed Holmes and wrote an excellent piece.

September 3, 2010

BMR Morning Market Musings…

Gold traded as high as $1,255 this morning but has retreated on better than expected U.S. jobs data…as of 7:50 am Pacific, the yellow metal is off $10 an ounce to $1,241 after hitting a low of $1,237…the TSX Gold Index is down almost 2% but the CDNX has shrugged off the drop in Gold which is a very positive sign that further illustrates just how strong this market is right now (this action also tells us new highs in Gold are likely on the way)…the CDNX is up 16 more points to 1547 and is now within the resistance band between 1546 and 1550 that John identified in his chart analysis this morning…if the CDNX manages to quickly and decisively bust through this resistance, John says the next near-term targets are 1575 and 1625…Gold Bullion Development (GBB, TSX-V) is unchanged at 68 cents…not surprisingly, the stock found some resistance this morning near the June all-time high of 71 cents but the bulls appear to be firmly in control of GBB at the moment…an exploration update with additional drill results are expected from Gold Bullion sometime next week…we got an email an hour ago from our technical analyst (John) that the GBB chart is on the front page of the latest Resource World Magazine…Richfield Ventures (RVC, TSX-V) has announced it has arranged a non-brokered private placement financing of nearly $15 million at $1.95 a share…this comes a day after the company released some more outstanding results from its Blackwater Project in central British Columbia…we see this as a positive move as Richfield will now have almost $20 million in the bank to aggressively develop Blackwater as a potential world class gold deposit…our thinking is that this could be the last financing Richfield will need to do prior to a potential takeover…Peter Bernier’s strategy, we think, is to move Blackwater along far enough to interest a major to step in…RVC is another exciting play that we introduced to our readers last December when it was trading at $1.20…Richfield is currently off 9 cents to $1.99…Sidon International (SD, TSX-V) is up 1.5 cents to 13.5 cents…with Canaco’s (CAN, TSX-V) recent success, interest in Tanzania is very high at the moment so Sidon has an incredible opportunity on its hands with its Morogoro East Property which is approximately 60 miles south of Canaco’s Handeni Project…we’re not ready to give up on North Arrow Minerals (NAR, TSX-V) just yet…a decision on NAR’s Lac de Gras drill permit is expected next week and we believe there’s a possibility NAR may seize the moment and do something with its recently acquired claims 70 kilometres east of Atac Resources’ (ATC, TSX-V) red-hot Rau gold discovery in the central Yukon…North Arrow is unchanged at 15 cents this morning…

CDNX Chart Update

The CDNX is performing as expected and the outlook for this market over the final 4 months of the year is very positive – a new 52-week high by year-end is a strong possibility.  The CDNX overcame significant resistance at 1500 this week without much difficulty and now the next test is 1550 where John has identified another band of resistance as he explains below:

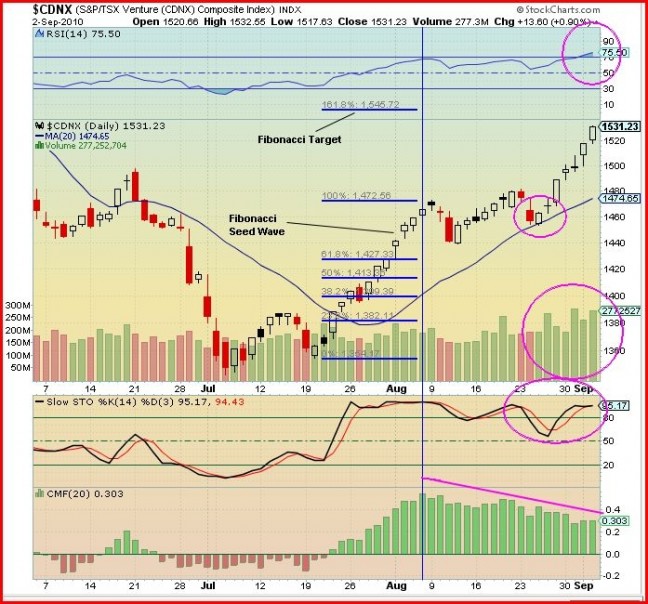
Yesterday the CDNX again showed significant strength by surging nearly 14 points on the second highest volume since mid-May.   It opened at 1521, drifted lower to 1518, and then rose steadily to a high of 1533 before closing at 1531.   This indeed was a show of strength.

Looking at the 3-month daily chart there was a bullish reversal on July 20 and a new bullish uptrend wave started.  This first wave is called the Fibonacci seed wave and is normally between 8 and 13 trading sessions long from the reversal to the peak.  This one is exactly 13 at the moment.  This wave is considered to be from 0% to 100% as shown and the extension to the 161.8% gives the Fibonacci target level which is 1546.   There is significant resistance at the 1550 level (not possible to show on this chart), thus the CDNX can expect to meet a resistance band between 1546 and 1550.

Please note that when the Index meets a resistance band it does not mean it will necessarily retrace very much –  it means you can expect it to take time to work though this band.  The uptrend can still be intact.   The daily SMA(20) provides solid support and keep in mind if the Index level gets too far away from this moving average it will retrace towards it.

From Aug 12 the average daily volume has been increasing, demonstrating the strengthening interest in the CDNX market.

Looking at the indicators:

The RSI shows it is just entering the overbought region but there is plenty of room for the CDNX to move up before the overbought peaks.

The Slow Stochastics shows that both the %K and %D lines are high in the overbought area and have been for most of the last 5 weeks.  This is because the CDNX is strong at the moment and usually closes near its high for the day. This will not cause a problem at the present time.

The Chaikin Money Flow (CMF) indicator is green, showing a bullish level of buying power and the steady decline in buying pressure from Aug 6 is primarily due to seasonal effects and should increase again after the Labour Day long weekend.

Outlook: The CDNX is very strong right now but a pause at 1550 as it meets a resistance band can be expected.  The downside is quite limited.  We can, I believe, look forward to a continuing uptrend through the end of the year.

September 2, 2010

BMR Morning Market Musings…

The stage continues to be set for Gold’s eventual breakout to new highs…the yellow metal is up $8 per ounce to $1,252 as of 8:30 am PacificSilver is 23 cents higher at $19.58…the CDNX is up 7 more points to 1525…this market is showing every sign of pushing significantly higher this month as we predicted earlier based on numerous technical indicators…Gold Bullion Development (GBB, TSX-V) is up a nickel to 66 cents on over a million shares on the CDNX (GBB has also been trading significant volumes on the ALPHA system)…BMR’s technical analyst is working on an updated GBB chart which will posted this weekend…Gold Bullion stated Tuesday it expects to release additional drill results from Granada sometime next week…each exploration update from Gold Bullion this year has gotten more interesting which bodes well for next week as this large project continues to develop…Richfield Ventures (RVC, TSX-V), which we first introduced to BMR readers last December at $1.20, is up 13 cents to $2.05…Richfield reported 6 more holes this morning from its Blackwater Project in central British Columbia which further demonstrate the world class potential of this property…the company continues to drill long intersections of mineable grade including significant widths of 1 g/t Au or better in 3 zones at Blackwater which could be part of one large overall system…the best hole reported today was 282 metres grading 1.41 g/t Au…that is a stellar hole by any standard…Richfield’s current market cap is just under $60 million, so there is a lot of room for further growth here if good results continue to flow in…there’s no reason to believe that won’t happen based on the consistency of results so far…we hope to do another interview with President and CEO Peter Bernier in the near future…there is significant technical resistance at $2.25, Richfield’s 52-week high, which it nearly touched this morning ($2.23)…it should be only a matter of time before this resistance is overcome…Seafield Resources (SFF, TSX-V) is also enjoying a strong day today…Seafield is up 1.5 cents to 21.5 cents on volume of over half a million shares…we’ve stated all along, Seafield has assembled a high quality land package in the Quinchia District of Columbia, right on the doorstep of Medoro’s (MRS, TSX-V) 10 million ounce Marmato Deposit…it should be a busy month for Seafield with drill results expected from Miraflores and a drill campaign likely to commence at Dos Quebradas, the 2nd of 3 outstanding targets for Seafield at Quinchia…Seafield is hoping to outline 2 million compliant inferred ounces at Quinchia after drilling Miraflores and Dos Quebradas (right now they have 800,000 compliant and 800,000 non-compliant)…the entire land package holds excellent potential for a series of deposits totaling 3 to 5 million ounces…Sidon International (SD, TSX-V) is up half a penny to 12 cents…John’s updated chart on SD last night clearly shows the strong technical support this stock has around current levels…we remain excited about Sidon’s Morogoro East Property in Tanzania which holds considerable exploration upside and a lot of market appeal given Canaco’s (CAN, TSX-V) success just 60 miles away…Sidon is somewhat “range bound” at the moment, however, until it closes its recently proposed private placement at 10 cents…

« Newer PostsOlder Posts »
  • All Posts: